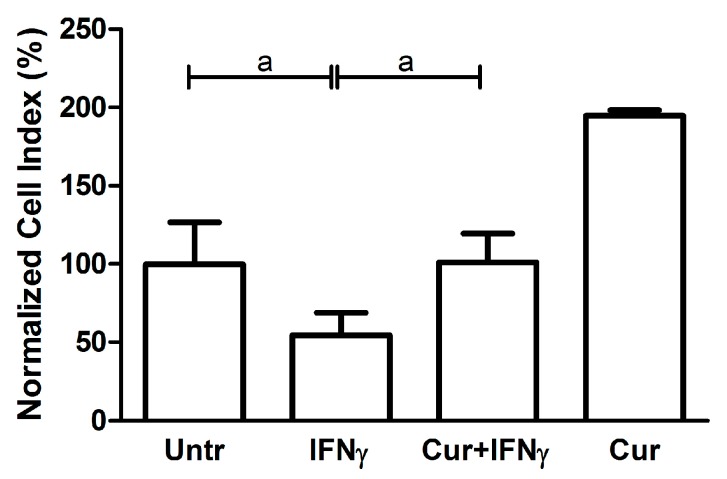
Figure 6.
Impedance analysis of HT29 pre-treated with curcumin. The HT29 cells were pre-treated with curcumin (Cur, 24 h after seeding), and stimulated with IFNγ (48 h after seeding). The histograms represent, as a percentage (%), the mean of the normalized cell index values, reached after about 48 h IFNγ stimulation, compared to the untreated condition (Untr). Data are expressed as the mean ± SD. Data analyses were performed with one-way ANOVA and the Bonferroni post-test (a: p < 0.05).

