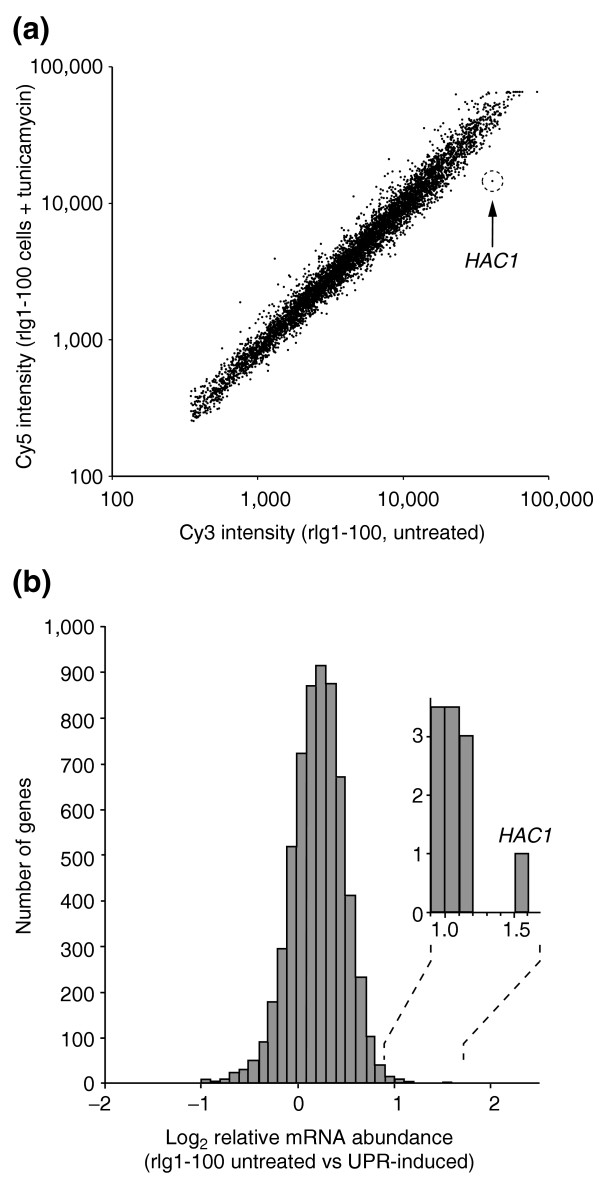
Figure 5.

HAC1 is the only transcript decreasing in rlg1-100 cells following tunicamycin treatment. (a) Scatter plot of Cy3 and Cy5 signal intensities following hybridization to a yeast ORF microarray with both Cy3- and Cy5-labeled probes, prepared from RNA isolated from rlg1-100 cells either untreated or treated with tunicamycin for 40 min, respectively. Points below the diagonal represent ORFs that hybridize predominantly to RNAs represented in the Cy3 probe, and which are therefore present at reduced levels upon tunicamycin treatment. The position of the spot displaying the brightest Cy3 signals (corresponding to the HAC1) is shown. (b) Histogram presentation of microarray data measuring log2 of the relative mRNA abundance between tunicamycin treated (40 min) and untreated rlg1-100 cells. Levels of most mRNAs were not altered, and the only mRNA significantly changed upon tunicamycin treatment is HAC1. Inset, HAC1 is the only gene with a log2 fold-change in abundance near 1.5. All data displayed in Figure 5 are provided in Additional data file 3.
