Fig. 2.
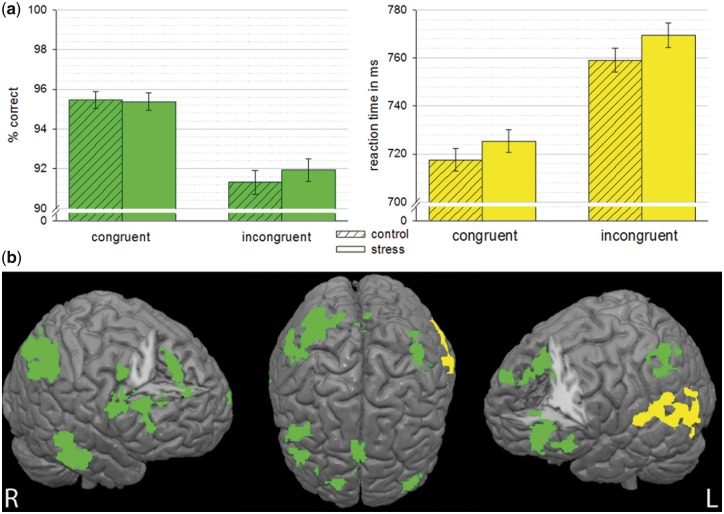
(a) Behavioral data for congruent and incongruent trials under stress (plain) and control (striped). Response accuracy given in percent correct responses (green). Mean reaction times (yellow) are displayed for correct response trials only. Error bars indicate 95% CI. (b) Association of increase in accuracy (green) and decrease in speed (yellow) in the task with increase in brain activation in stress compared to control (for incogruent trials only, controlled for main effect of stress). Results are cluster level corrected threshold (Z > 2.3, P < 0.05) and overlaid on an MNI template brain.

