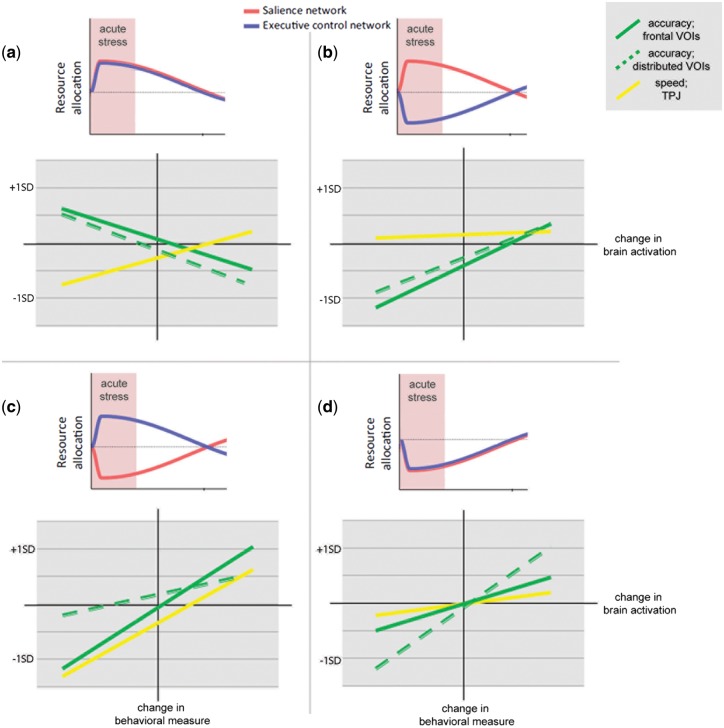
Fig. 3.
The moderation analysis can be illustrated at four prototypic ‘brain network connectivity profiles’. These profiles were characterized by a distinct pattern in change of connectivity in the two networks in stress. (a) profile which showed increase in connectivity in stress in SN and ECN (b) profile which showed increase in connectivity only in SN and decrease in ECN (c) profile which showed increase in ECN and decrease in SN and (d) profile which showed decrease in connectivity in both. For each brain state, the correlation between brain and behavior is displayed, the plots depict the correlation from the VOIs (frontal VOIs: DLPFC, IFG, pgACC, distributed VOIs: DMPFC, AG, MTG). Change in reaction time or percent correct is plotted on the y-axis and change in brain activation on the x-axis. Positive values represent an increase of activity in stress and negative a decrease in stress. Slopes and offset were generated by the moderated moderation based on + 1 and −1 SD in all scales, that is the different profiles represent the variance in network connectivity observed in our sample and how this variance influenced brain–behavior associations.

