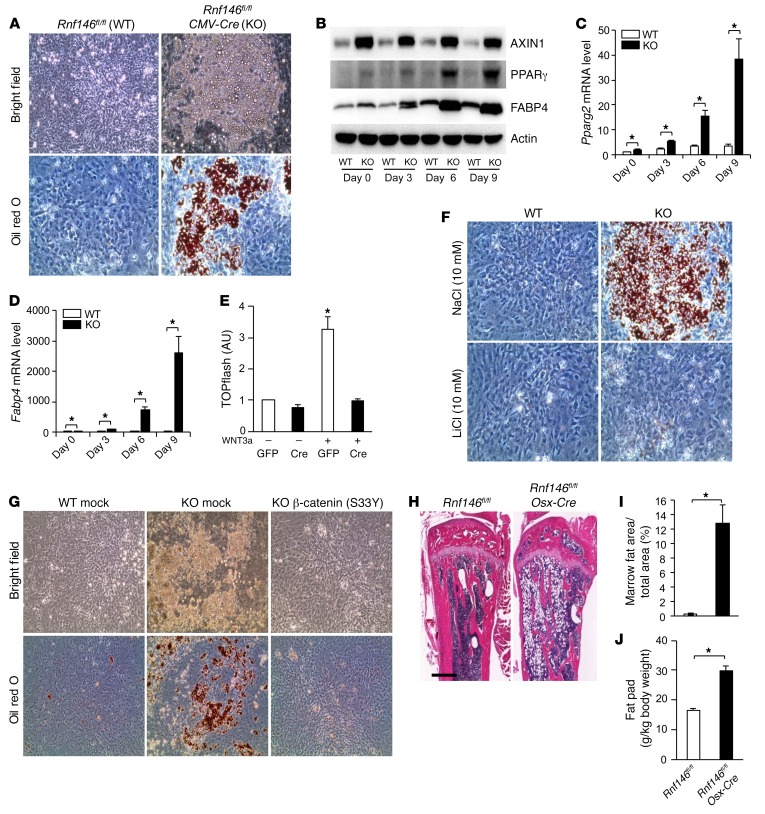
Figure 6. RNF146 represses adipocyte development and fat stores.
(A) MEFs isolated from Rnf146fl/fl (WT) and Rnf146fl/fl CMV-Cre (KO) embryos were cultured in adipogenic medium and stained with oil red O. Top panels, bright field images; bottom panels, oil red O staining. Original magnification: ×200. (B) Whole cell lysates from cells in A cultured in adipogenic medium for 3–9 days were probed with the indicated antibodies for Western blot analysis. (C and D) qPCR analysis of Pparg2 (C) or Fabp4 (D) mRNA expression in cells in A cultured in adipogenic medium for 3–9 days. n = 3. (E) Luciferase activity from a TOPflash reporter assay in cells in A cultured in serum-free medium in the presence or absence of WNT3a (40 ng/ml). n = 3. (F) Oil red O staining of MEFs in A cultured in adipogenic medium in the presence or absence of NaCl (10 mM, top panels) and LiCl (10 mM, bottom panels). Original magnification: ×200. (G) MEFs in A infected with an empty vector control (mock) or a β-catenin–expressing (S33Y) retroviral vector were cultured in adipogenic medium and stained with oil red O. Top panels, bright field images; bottom panel, oil red O staining. Original magnification: ×200. (H) H&E staining of tibiae from 12-week-old Rnf146fl/fl and Rnf146fl/fl Osx-Cre mice. Scale bar: 500 μm. (I) Quantification of trabecular bone marrow fat area in tibiae in H. n = 5–6. (J) Fat pad mass (fat pad weight over body weight) from 6-month-old Rnf146fl/fl and Rnf146fl/fl Osx-Cre mice. n = 3. P values were determined by ANOVA with Tukey-Kramer’s post-hoc test (E) or unpaired t test (C, D, I, and J). Data are presented as mean ± SEM. *P < 0.05.

