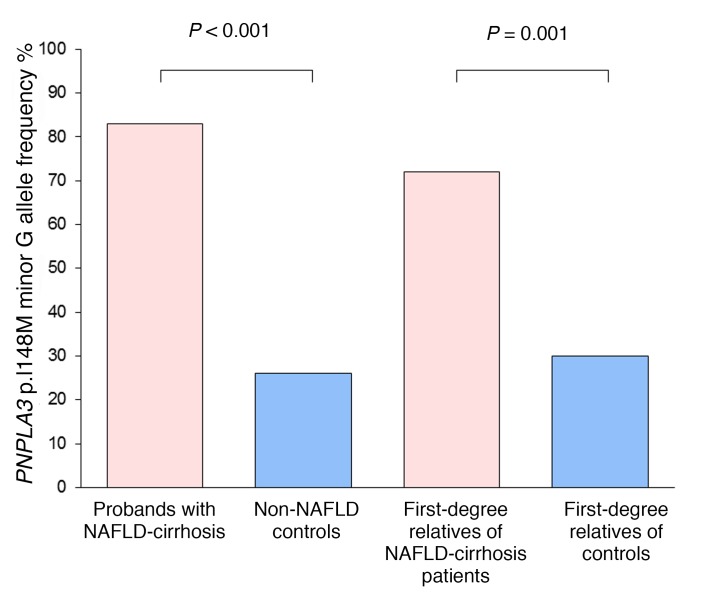
Figure 5. PNPLA3 p.I148M minor G allele frequencies.
The allele frequency of PNPLA3 p.I148M minor variant G is expressed as percentage of minor allele G in probands with NAFLD-cirrhosis (pink bar; total n = 12 alleles) compared with non-NAFLD controls (blue bar; total n = 92 alleles) and percentage of first-degree relatives of patients with NAFLD-cirrhosis (pink bar; total n = 46 alleles) compared with first-degree relatives of controls (blue bar; total n = 88 alleles). P value was determined using a Fisher exact test or a χ2 test when appropriate.

