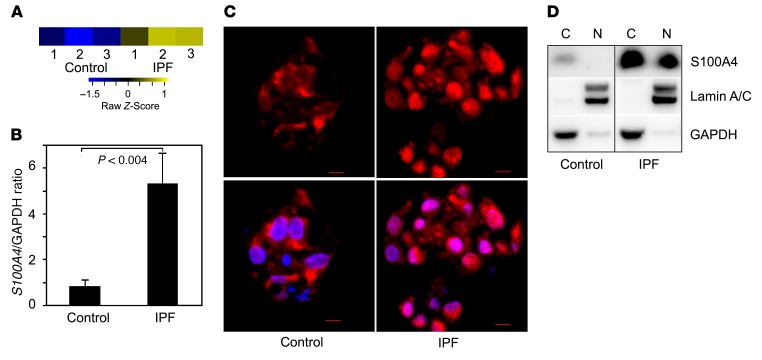
Figure 1. IPF MPCs display increased S100A4, which localizes to the nucleus.
(A) Genome-wide RNA sequencing data. Shown is the heatmap for S100A4 gene expression in IPF and control MPCs derived from 3 IPF patients and 3 control patients based on our previously published data (14). Colors represent per gene Z score (expression difference normalized for standard deviation). (B) Validation testing for S100A4 mRNA expression in IPF and control MPCs. Shown are relative expression levels of each mRNA by qPCR. Data shown represents the mean mRNA levels in IPF MPCs derived from 3 cell lines. (C) Immunocytochemical analysis illustrating S100A4 location in IPF and control colony-forming MPCs (red, S100A4; blue, DAPI; n = 3). Scale bar: 5 μm. (D) Western blot analysis of S100A4 expression in nuclear (N) and cytoplasmic (C) fractions of IPF and control MPCs. Lamin A/C and GAPDH were used as loading controls. Data are expressed as mean ± SEM. P value in B was determined by 2-tailed Student’s t test.

