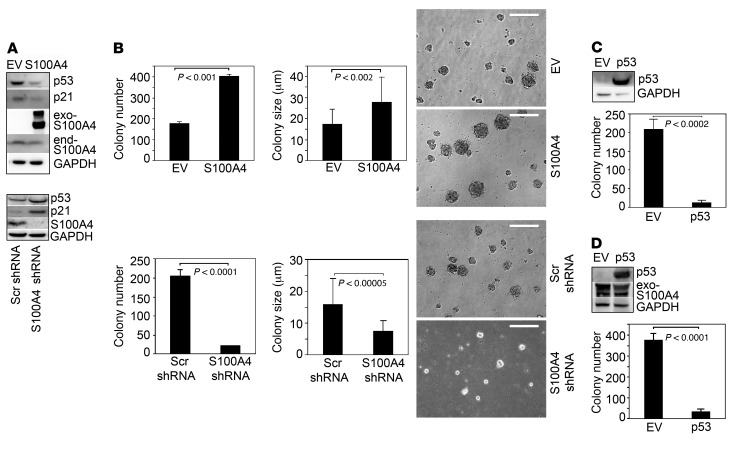
Figure 2. S100A4 regulates IPF MPC self-renewal.
(A) IPF MPCs were infected with lentiviral vector containing WT S100A4 (S100A4) or empty vector (EV; top panel) or S100A4 shRNA or scrambled (Scr) shRNA (bottom panel) to achieve gain or loss of function. p53, p21, and S100A4 expression were quantified by Western blot analysis. GAPDH was used as loading control. Exo-S100A4, exogenous S100A4; end-S100A4, endogenous S100A4. (B) IPF MPCs were infected with a lentiviral vector containing WT S100A4 (S100A4) or empty vector control (EV) or S100A4 shRNA or scrambled (Scr) shRNA. Five-thousand cells were seeded per well in 24-well dishes containing methylcellulose, and they were cultured for 7 days (n = 3). Left panels: colony number was quantified by enumeration. Middle and right panels: graphs depicting colony size and phase contrast image of IPF MPC colony formation, respectively. Scale bar: 50 μm. (C) IPF MPCs were infected with an adenoviral vector containing WT p53 (p53) or empty vector (EV) and cultured in methylcellulose for 7 days. Left panel: Western blot analysis was performed to assess p53 protein expression. Right panel: colony number was quantified by enumeration (n = 3). (D) IPF MPCs overexpressing S100A4 were infected with an adenoviral vector containing WT p53 (p53) or empty vector control (EV). Left panel: Western blot analysis was performed to assess p53 protein expression. GAPDH was used as a loading control. Right panel: colony number was quantified by enumeration (n = 3). The data were replicated using MPCs isolated from an independent primary mesenchymal cell line. Data are expressed as mean ± SEM. P values in B–D were determined by 2-tailed Student’s t test.

