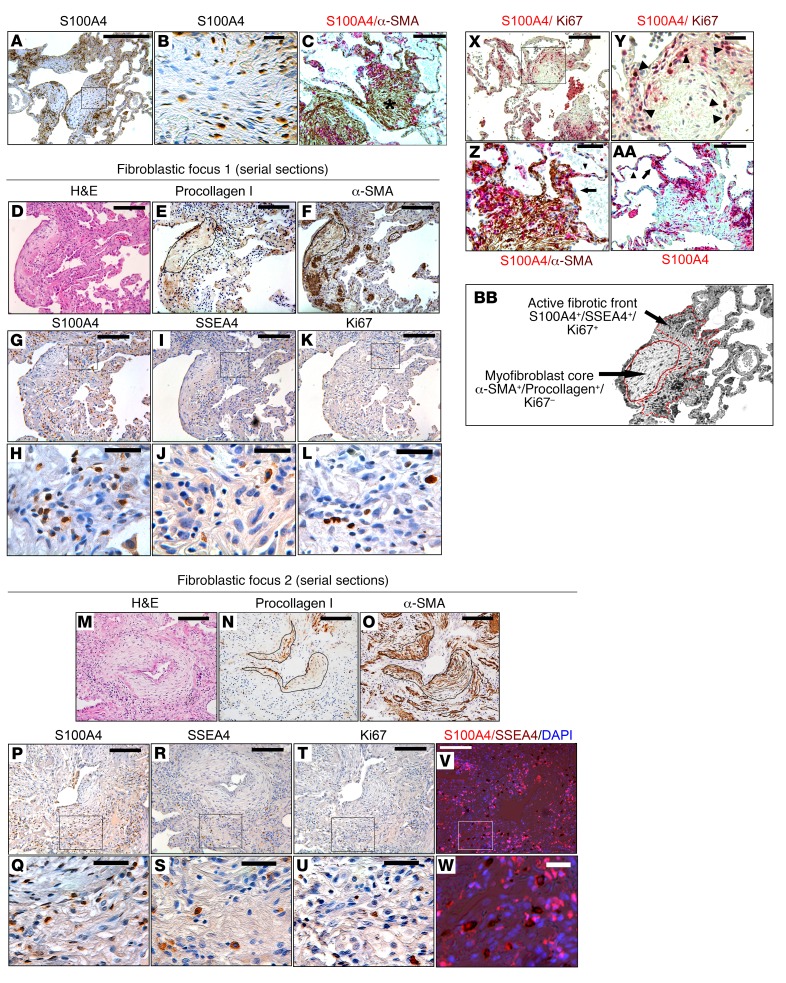
Figure 6. The IPF fibroblastic focus is a polarized structure.
IHC was performed on human IPF lung tissue (n = 10). (A) IHC showing distribution of S100A4 expression in fibroblastic foci. Scale bar: 200 μm. (B) Higher-power image of boxed region in A. Scale bar: 20 μm. (C) Double stain for S100A4 (red) and α-SMA (brown) defining the distribution of S100A4- and α-SMA–expressing cells in the fibroblastic focus. Asterisk, myofibroblast core. Scale bar: 50 μm. (D–W) Serial 4-μm sections of 2 representative fibroblastic foci. (D–F and M–O) H&E (D and M), procollagen (E and N), and α-SMA (F and O) staining of the focus. Scale bar: 100 μm. Outline in E, F, N, and O delineate the focus core. (G–L and P–U) IHC for S100A4 (G, H, P, and Q), SSEA4 (I, J, R, and S), and Ki67 (K, L, T, and U). (G, I, K, P, R, and T). Scale bar: 100 μm. (H, J, L, Q, S, and U) Higher-power images of boxed regions in G, I, K, P, R, and T. Scale bar: 20 μm. (V and W) Low- and high-power images showing IHC for SSEA4 (brown) overlaid with immunofluorescence for S100A4 (red). Nuclei are stained with DAPI. Scale bar: 100 μm (V) and 20 μm (W). (X) Double stain for S100A4 (red) and Ki67 (nuclear brown signal). Scale bar: 100 μm. (Y) Higher-power image of boxed region in X. Arrowheads denote individual cells positive for both S100A4 and Ki67. Scale bar: 20 μm. (Z and AA) IHC staining of fibroblastic foci for S100A4 (red). Z is a higher power image of C. Arrow denotes thickened alveolar walls. Arrowhead denotes normal thin alveolar walls. Scale bar: 20 (Z) and 50 (AA) μm. (BB) Higher-power image of A depicting the active fibrotic front and myofibroblast core of the polarized fibroblastic focus (100×).

