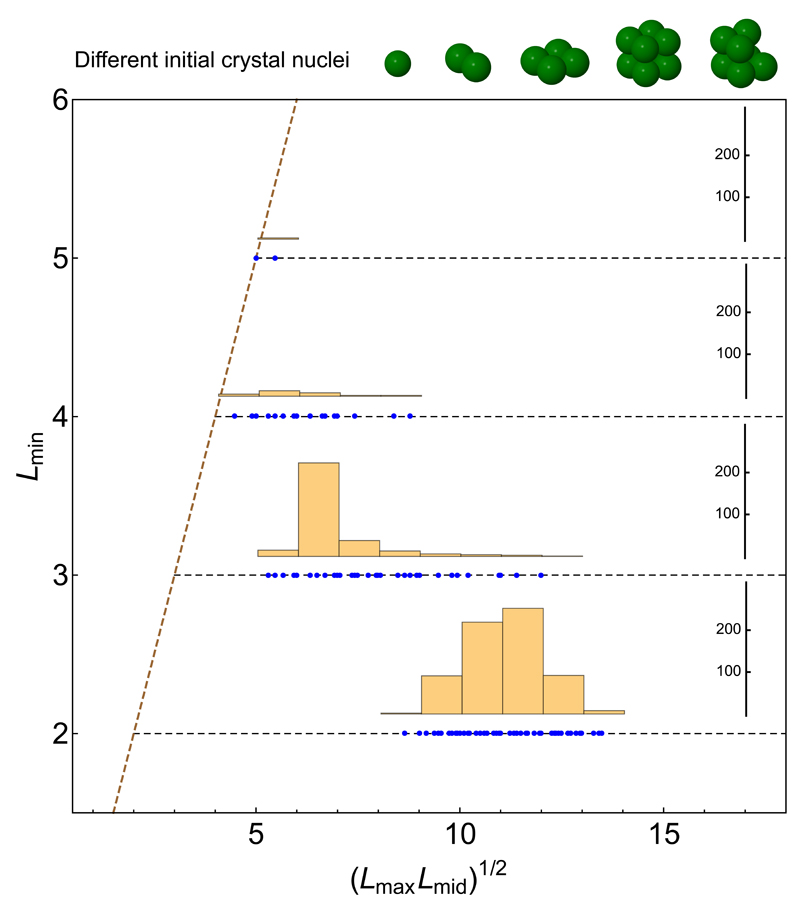
Figure 4. Shape distribution of nanocrystals grown via kinetic Monte Carlo simulations.
Five different nuclei of various specific shapes (shown at top) were allowed to grow at 650 K. For each shape, 200 simulation runs were performed (see Supplementary Section 1.f for details). The resulting nanocrystal from each simulation was characterized by a rectangular box (in units of monomers) most closely corresponding to its shape. The plot abscissa is the geometric average of the two largest box dimensions, and the ordinate is the shortest linear box dimension. Each simulation outcome is plotted as a blue dot and the histograms show the size distributions of nanocrystals with minimum thicknesses ranging from 2 to 5 monolayers. The diagonal dashed line depicts the (hypothetical) case of isotropic shapes, i.e., cubical nanocrystals. The horizontal dashed lines indicate nanocrystals with a minimum dimension (i.e., thickness) of 2, 3, 4, and 5 monolayers. Data points far to the right on these horizontal lines are highly plate-like. Nanocrystals with 2 and 3 monolayers strongly resemble experimentally synthesized nanoplatelets. For thicker nanocrystals (4 and 5 monolayers) a trend toward forming more isotropic shapes is apparent, consistent with experimental results.

