
Figure 4.
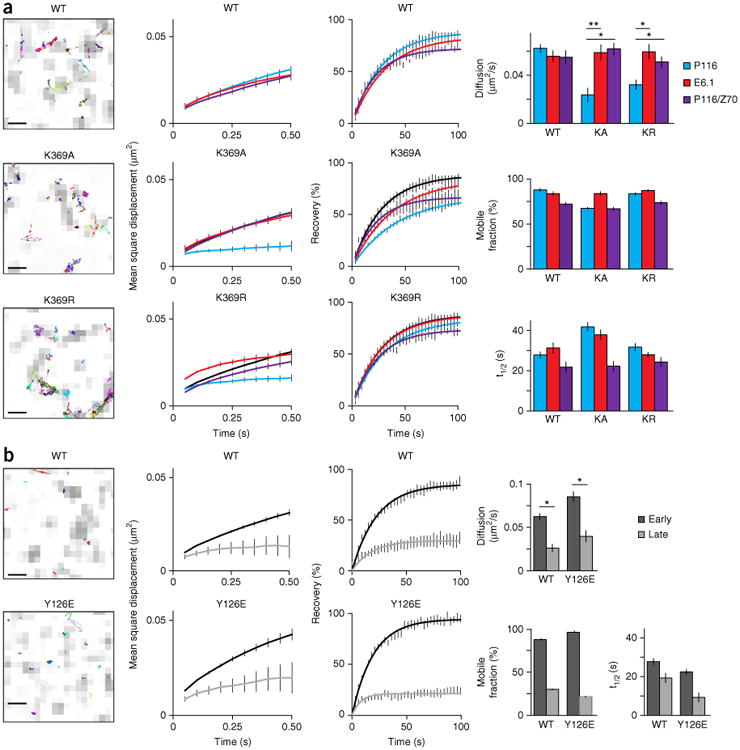
Trans-autophosphorylation mediates the release of Zap70 during early T cell activation. (a) Single-molecule trajectories of wild-type or mutant Zap70 (above plots) in E6.1 cells, presented as an overlay on TCR microclusters (CD3ζ-GFP) (far left; presented as in Fig 1a, far right); MSD plots for wild-type or mutant Zap70 (above plots) in P116 cells (cyan lines), E6.1 cells (red line) or P116 cells re-expressing wild-type Zap70 (purple lines), with wild-type Zap70 in P116 cells (black lines) included in each plot for comparison (middle left); FRAP curves for each cell line at left (middle right); and diffusion rates from tracking (top), plus the mobile fraction (middle) and recovery rate (t1/2; bottom) for the analyses at left (far right). (b) Single-molecule trajectories of wild-type Zap70 (top) and Zap70 Y126E (bottom) in P116 cells, assessed at a late time point (far left); MSD plots for wild-type or mutant Zap70 (above plots) in P116 cells at an early time point (<10 min; black line) or late time point (>30 min; gray line) (middle left); FRAP curves for wild-type Zap70 and Zap70 Y126E at early and late time points (middle right; as at left); and diffusion rates from tracking experiments, plus the mobile fraction and recovery rate (t1/2) (far right). Scale bars (far left), 500 nm. *P < 0.01 and **P < 0.001 (two-tailed unpaired t-test). Data are from three independent experiments (left and middle; average ± s.e.m. of at least ten cells (middle)) or are from three or more independent experiments with at least ten different cells (far right; average + s.e.m. (FRAP) or average ± 95% confidence interval (mobile fraction and recovery rate)).