Figure 2.
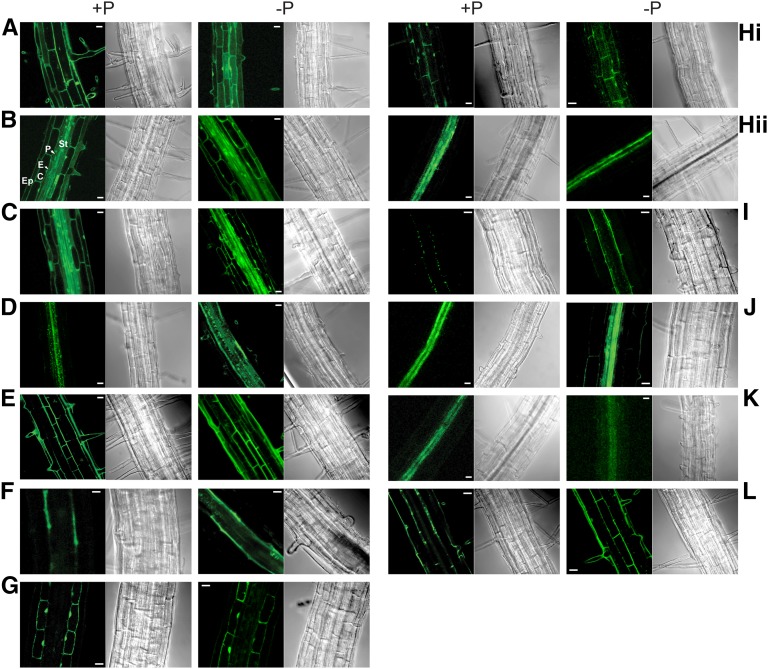
Fluorescence imaging of PRCE promoter-GFP lines. Confocal imaging of GFP fluorescence in roots of reporter lines of selected PRCE genes identified their cell type-specific expression patterns. For each line, the left image shows a representative image of observed GFP signals and the right image shows the corresponding bright-field image. Images where taken under P-replete (+P) and P-limited (−P) growth conditions as indicated. Genes and their localizations are as follows: ACX5, epidermis (A); CBL1, ubiquitous (B); CIPK2, ubiquitous (C); CIPK14, stele (D); MFS1, epidermis (E); PRCE2, pericycle (F); PRCE3, cortex (G); PSF2, epidermis (Hi) and inner stele (Hii); S6K2, pericycle (I); SAG14, inner stele (J); STP10, xylem parenchyma (K); and WDD1, epidermis and endodermis (L). For the CBL1 promoter-GFP line with ubiquitous expression throughout the root, the different cell types are marked: C, cortex; E, endodermis; Ep, epidermis; P, pericycle; and St, stele. The details of the number of lines characterized for each gene are outlined in Supplemental Table S1. Bars = 20 µm.

