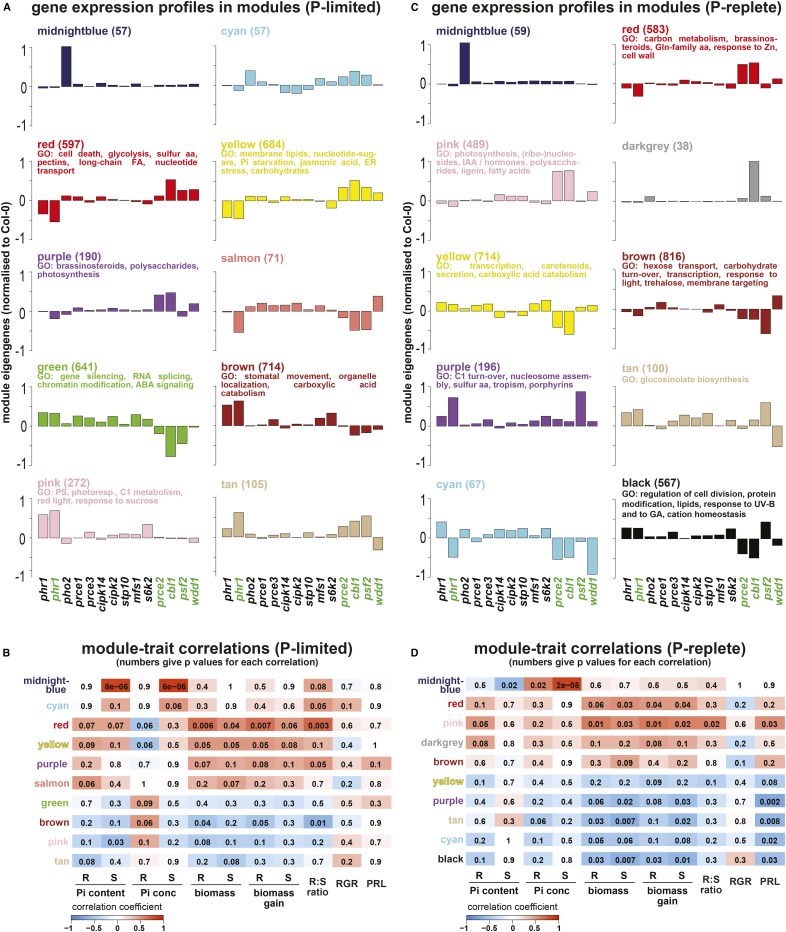
Figure 8.
WGCNA of RNA-seq and physiological trait data was carried out independently for P-limited (A and B) and P-replete (C and D) plants. This identified groups of genes (color-coded modules) sharing coexpression patterns across genotypes that were subsequently correlated to physiological shoot (S) and root (R) traits (Pi content, Pi concentration, biomass, biomass gain, root-to-shoot ratio, root relative growth rate [RGR], and primary root length [PRL]). For select modules, eigengenes are shown as proxies of expression profiles for genes within each module, with the number of genes given in parentheses and statistically significant (P < 0.05, after Bonferroni correction) enriched Gene Ontology (GO) terms for the top 300 or fewer hub genes listed (A and C). For all mutant lines, the eigengenes were normalized to Col-0. These eigengenes were used to identify gene networks (i.e. modules) with significance for quantified traits by correlation analysis (B and D). This identified several modules with high correlation coefficients to physiological traits, indicated in red color for positive correlations (ranging from 0 to 1) and in blue for negative correlations (ranging from 0 to −1), while the numbers within each colored box give the P values for the statistical significance of each correlation. For example, the midnight blue module for P-limited plants shows very high positive correlation (correlation coefficient of 0.98 and P < 8 × 10⁻⁶) with shoot Pi content and concentration (B). aa, Amino acids; ABA, abscisic acid; FA, fatty acids; IAA, indole-3-acetic acid.

