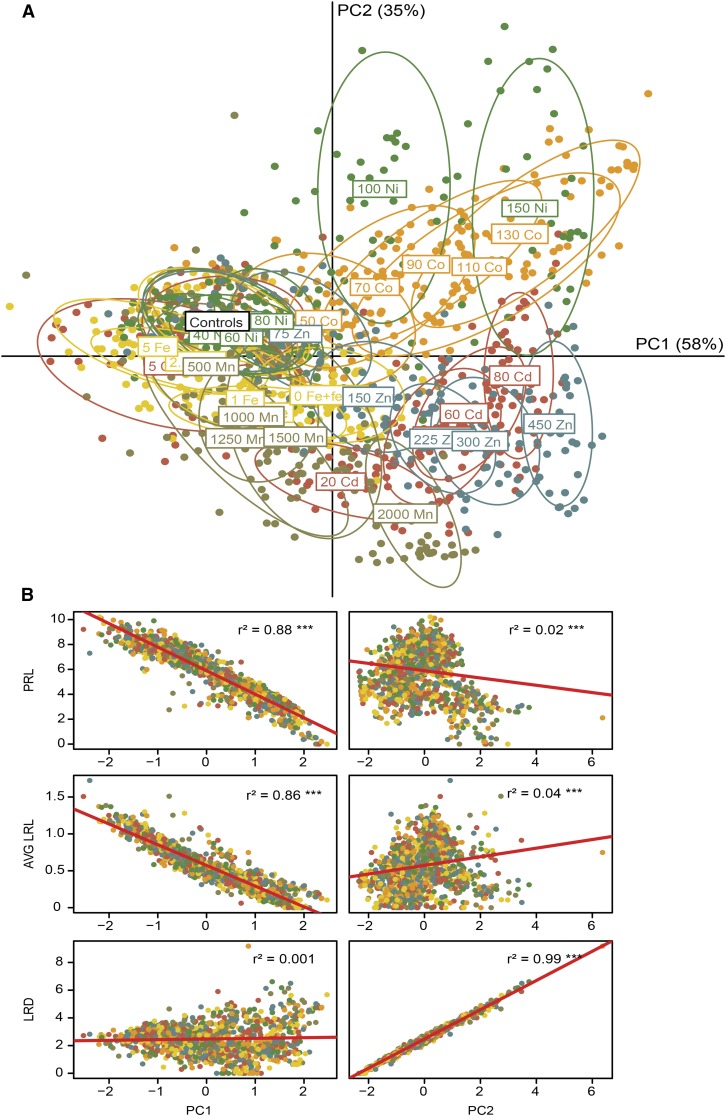
Figure 5.
PCA of the variation in RSA traits in response to Fe deficiency and heavy metal supplies. PCA was based on primary root length (PRL), lateral root density (LRD), and average lateral root length (AVG LRL) measured under the indicated treatments. A, PC1, explaining 58% of the variation, was plotted against PC2, explaining 35% of the variation. B, Correlation analysis of root traits and principal components. r2 values define coefficients of determination. Asterisks indicate statistical significance of the correlation between root traits and principal components: ***, P < 0.001.

