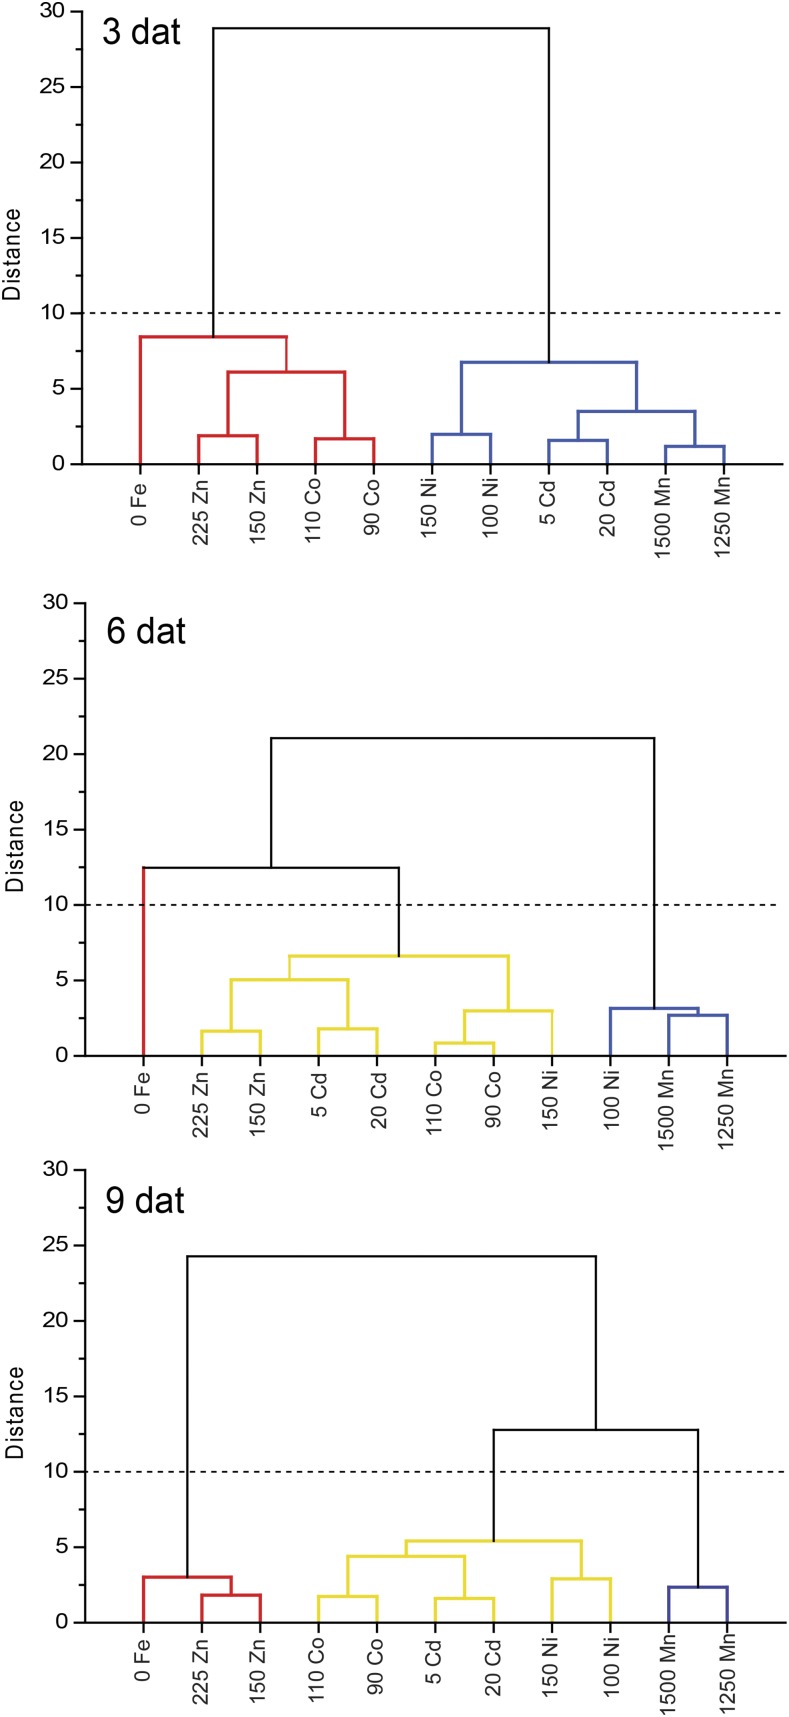
Figure 8.
Hierarchical cluster analysis of transcript levels in heavy metal and low-Fe treatments. The dendrogram was obtained by clustering 0 Fe (no Fe + 50 µm ferrozine) and heavy metal treatments based on log2-transformed values of fold change for each time point separately. The colors of the lines indicate cluster membership. dat, Days after treatment.

