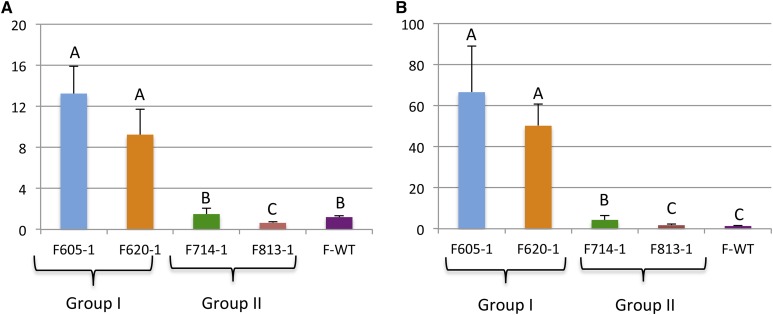
Figure 6.
qRT-PCR analysis of the Leghemoglobin gene family in the four Gmsacpd-c mutant soybean lines. Differences in expression are shown for the Legh-C1 (A) and Legh-C2 (B) genes between group I and group II mutants. The Legh-C3 gene was not expressed. Expression values were normalized using Ubiquitin as a reference. The gene-specific primers designed for qRT-PCR analysis are detailed in Supplemental Table S3. Results were analyzed with ANOVA (P < 0.0001). F-WT, The cv Forrest wild type.

