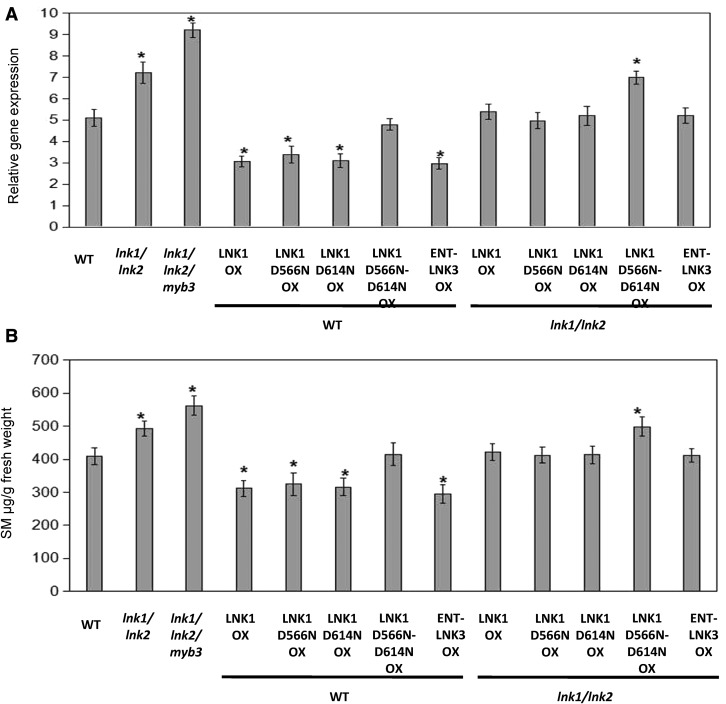
Figure 6.
LNK1 and LNK2 repress phenylpropanoids biosynthesis. A and B, Measurement of C4H gene expression (A) and SM (B) levels in indicated genotypes by LC/MS and qRT-PCR, respectively. Values are means ± sd of three biological repeats. Asterisks indicate statistically significant differences compared with wild-type and lnk1/lnk2 plants (P < 0.05, Student’s t test).

