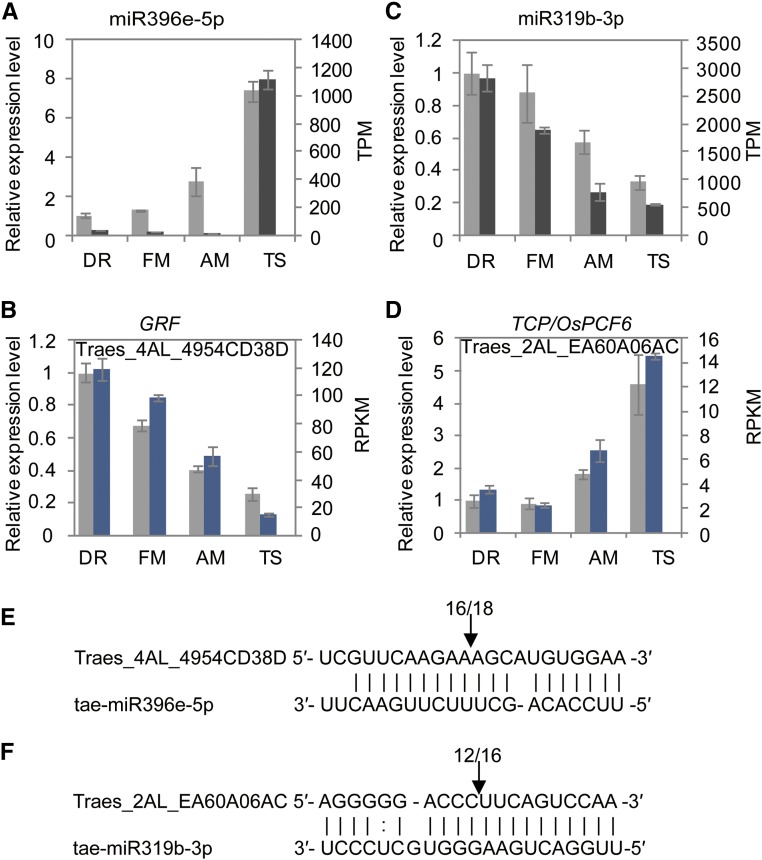
Figure 6.
Expression patterns of the highly expressed miRNAs and their predicted target genes in wheat inflorescence meristems. A to D, The expression level of miRNAs and their targets based on TPM/RPKM (black and blue) and qPCR (gray) data. The 18s rRNA was used as an endogenous reference to normalize the qPCR results. Each point of the TPM/RPKM represents the average of two biological replicates. Two biological replicates with similar pattern were performed for qPCR. Each point represents the average of three technical replicates. Error bars indicate sd. E and F, MiRNAs cleavage sites in targets mRNAs determined by RNA ligase-mediated 5′-RACE. The frequency of 5′-RACE clones corresponding to the site are indicated by numbers above arrows.

