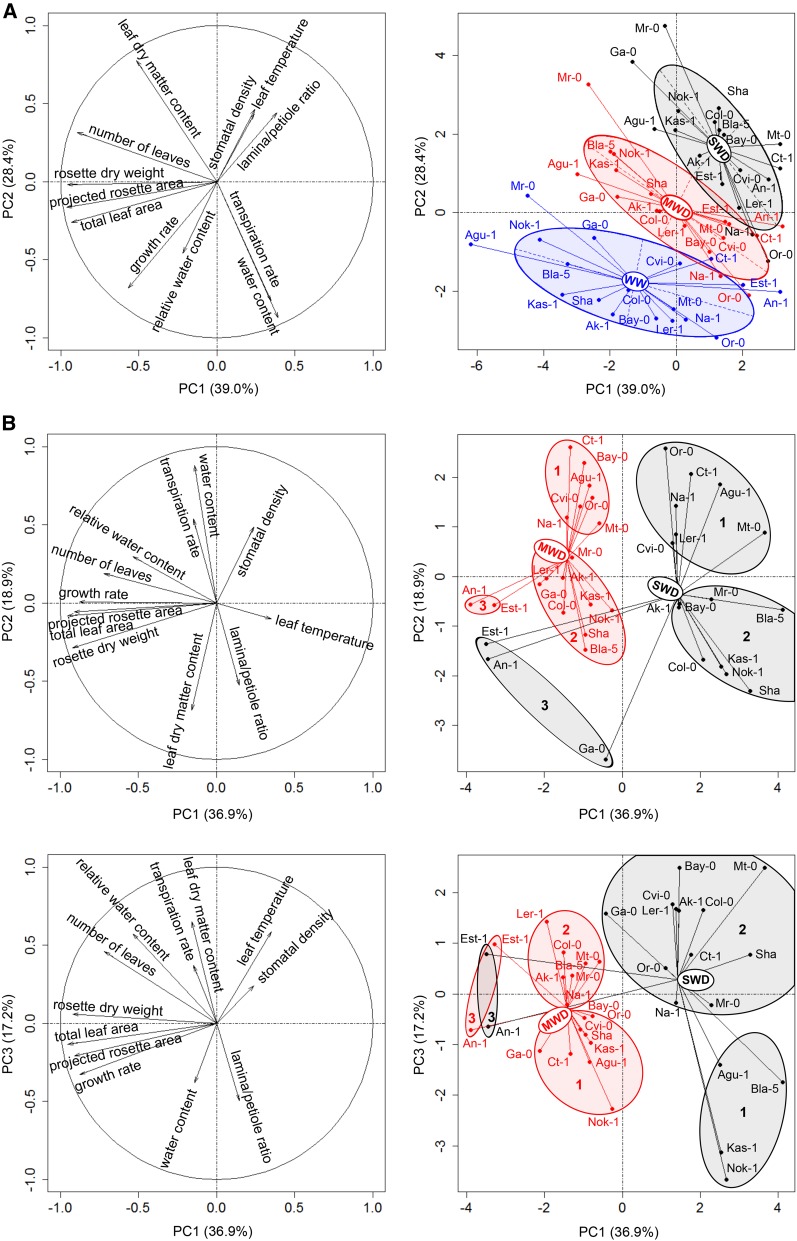
Figure 4.
PCA performed on the morphophysiological traits measured in 18 Arabidopsis accessions grown under three different watering conditions (WW, MWD, and SWD). A, Representation of morphophysiological traits (left) and individual accessions (right) with centers of gravity and lines connected to each accession for each condition. Three variables (i.e. leaf number, leaf dry matter content, and transpiration rate) were ln transformed before analysis to improve the normality of their distributions. Ellipses correspond to inertia ellipses of each group. Each ellipse is centered on the group mean, and its dimensions are 1.5 times the sd of the coordinates on the axes. The covariance sets the slope of the main axis (Thioulouse et al., 1997). B, Representation of traits (left) and individuals (right) from PCA performed on response ratios of morphophysiological traits considering the two WD treatments. Top parts correspond to the PC1:PC2 plane and bottom parts correspond to the PC1:PC3 plane. Ellipses show the results of k-means clustering (k = 3). Numbers in ellipses indicate different clusters obtained for MWD (red ellipses) and SWD (gray ellipses) treatments.

