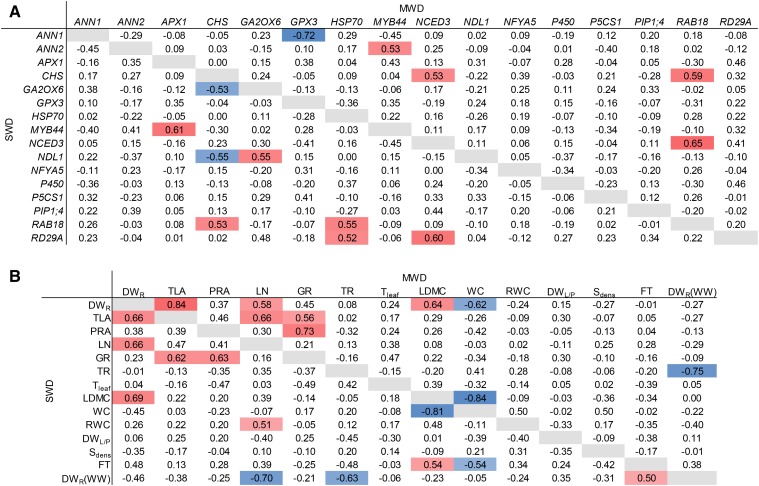
Figure 6.
Bivariate correlations between response ratios of gene expression (A) and morphophysiological traits (B) under MWD and SWD conditions. Numbers represent Spearman’s ρ for each pair of variables. Correlations with ρ ≥ 0.5 (red) or ρ ≤ −0.5 (blue) are highlighted. For trait abbreviations, see Supplemental Table S4. In B, the last column and last row represent correlations with rosette dry weight from WW conditions [DWR(WW)].

