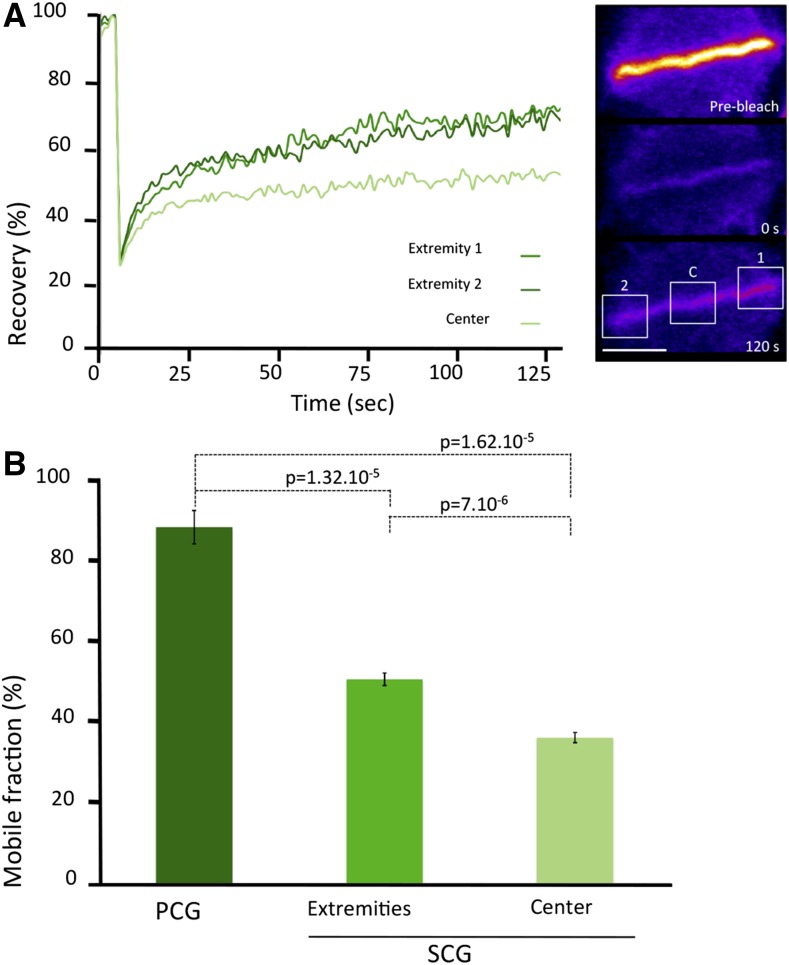
Figure 2.
FRAP analysis during cell plate growth. A, Typical FRAP curves at the extremities and in the center of a GFP-KN-labeled cell plate during SCG. Fluorescence intensity is normalized to background and prebleach values. Bar = 10 µm. B, Mobile fraction after FRAP on a GFP-KN-labeled cell plate during PCG and SCG at the extremities and in the center of the plate (average ± se; n = 6).

