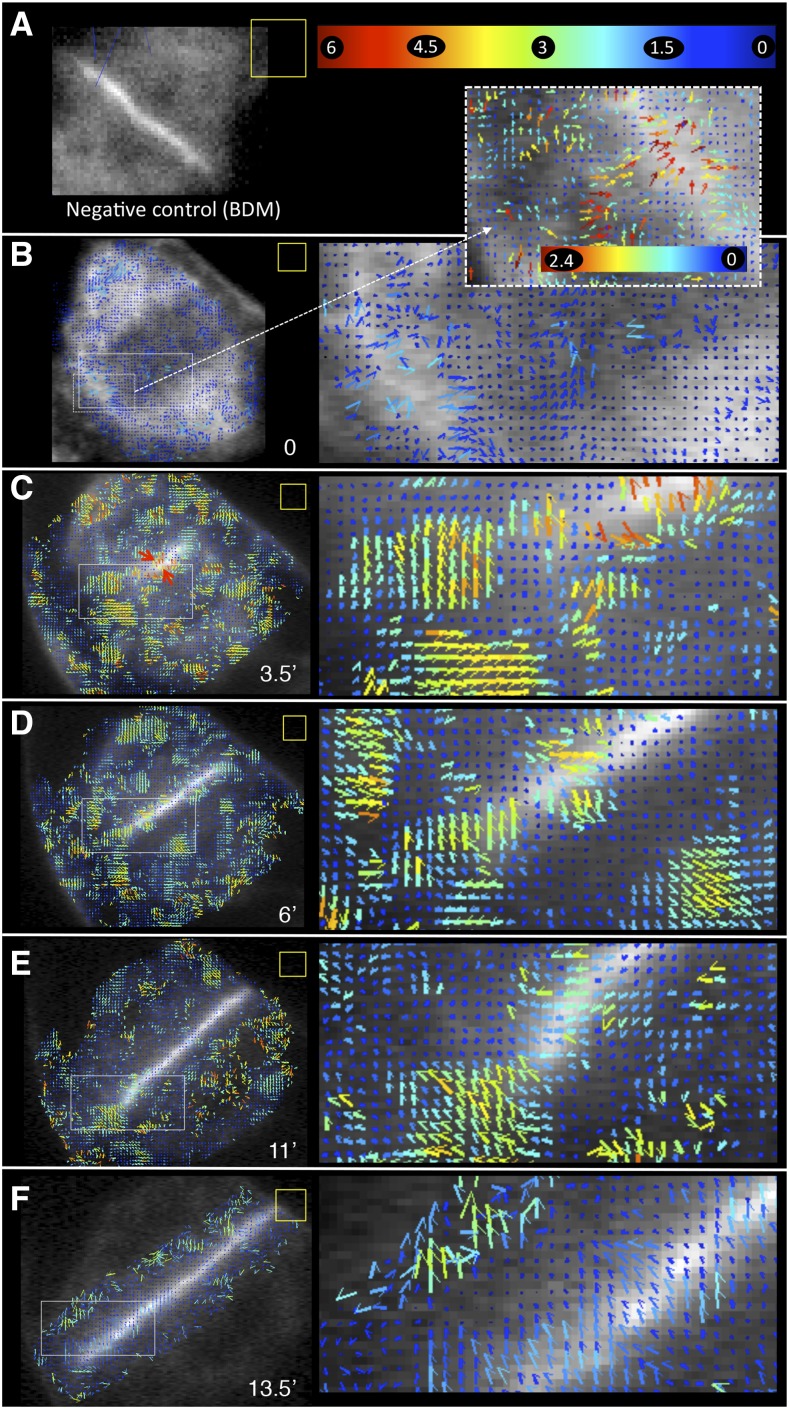
Figure 3.
STICS analysis of the vesicle supply to allow cell plate growth. Velocity maps of GFP-KN-labeled vesicles were analyzed over a 75-s period (100 frames). Numbers on the color bar at top right in A are movement rates in µm min−1. STICS analysis was not performed on complete images but on ROIs identified by the presence of vectors or blue dots. The color bar in A applies to all images (low magnification and insets) except for the dashed inset in B. ROI (yellow square) corresponds to 16 × 16 pixels (2.7 × 2.7 µm). The pixel shift was 2, except for B and E, where the pixel shift was 4. A, Negative control in the presence of BDM. B to F, Different stages of cell plate formation. Numbers at bottom right in each image indicate time in minutes.

