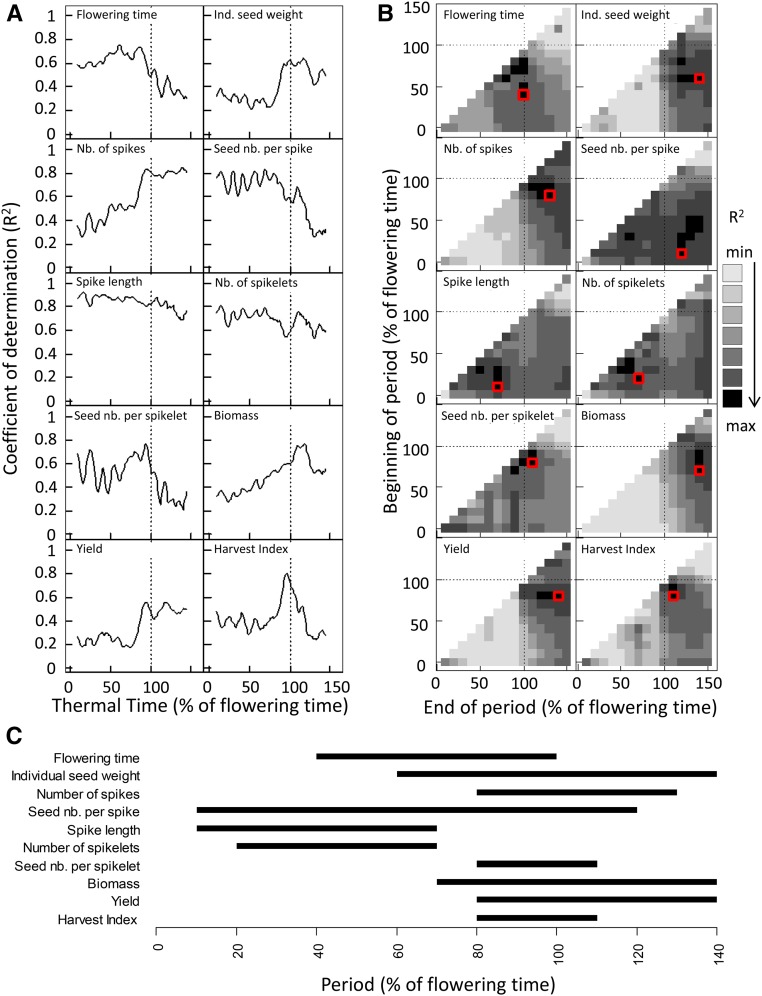
Figure 4.
Relationship between 10 biological variables and environmental variables (“Heat”, “Drought”, and their interaction) averaged in several periods of the crop cycle. Time is expressed as developmental time (percentage of thermal time at flowering). Flowering time is expressed as thermal time (d20°C). Heat is the difference between the average temperature of each trial during the considered period and the average temperature during the same period for the coolest trial, “Drought” is the average soil water tension of the considered trial during the period, and “Heat × Drought” is the interaction. The tested models are linear models linking each biological variable (e.g. flowering time and yield) and the predictors “Heat”, “Drought”, and “Heat × Drought” averaged during the considered period. R2 values are coefficients of determination of the tested linear model. A, Coefficients of determination of linear relationships linking biological variables and the environmental variables averaged on several periods of 5% of flowering time across the crop cycle. B, Coefficients of determination of linear models linking plant variables and the environmental conditions averaged on periods defined by their beginning (y axis) and their end (x axis). Each square displays the R2 for the considered period and the biological variable, from light gray (worst models with minimum R2) to black (best models with maximum R2). Best models are indicated by red squares and are summarized in C. C, Summary of the best models selected for each plant variable. Bars represent the development period for which the R2 was maximum.

