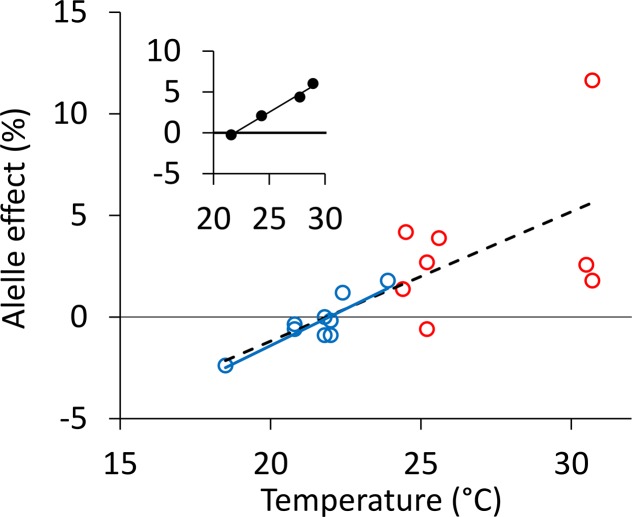
Figure 6.
Correlation between temperature around flowering time and allele effect at simple sequence repeat marker Xwmc236 located on chromosome 3B in the RAC875 × Kukri doubled haploid population analyzed previously by Bennett et al. (2012a, 2012b) and Bonneau et al. (2013). The allele effect is expressed as percentage relative to mean yield. A positive effect indicates that the RAC875 allele increased yield. Temperatures are mean temperature values in September in Australia and February in Mexico (from Table 1 in Bonneau et al., 2013). Allele effects come from Figure 4 in Bonneau et al. (2013). Each dot represents one trial. The blue dots and lines are 10 trials carried out in Australia with a correlation of R2 = 0.74 and P < 10−3. The red dots are eight trials carried out in Mexico with a nonsignificant correlation. The dashed line displays the correlation for the whole data set (R2 = 0.52, P < 10−3). The three trials of 2009 in the polytunnel platform analyzed in Table I, experiment D, are not presented here. The inset shows the correlation between average temperature around flowering time (x axis) and the average allele effect (y axis) in the four groups selected based on multienvironment correlation analysis by Bonneau et al. (2013). The group comprising the three trials in the polytunnel platform and analyzed in Table I, experiment D, is not presented here. Each dot is one group, and the line is the linear correlation (R2 = 0.99, P < 10−2).

