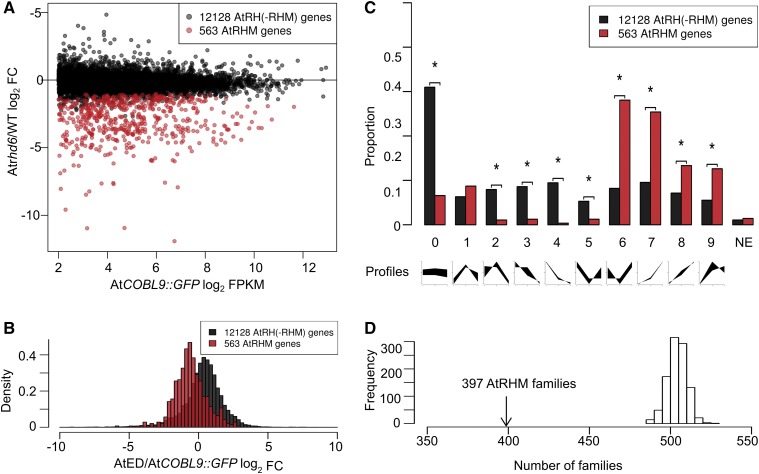
Figure 2.
Analysis of AtRH and AtRHM genes. A, Distribution of AtRH(-RHM) genes and AtRHM genes, based on transcript levels in the FACS-purified root hair cells of AtCOBL9::GFP and log2 fold change (FC) in transcript levels from FACS-purified cells of rhd6 WER::GFP versus wild-type WER::GFP. Data are means from three biological replicates. B, Distribution of AtRH(-RHM) genes and AtRHM genes, based on log2 fold change in transcript level from FACS-purified root hair cells of AtCOBL9::GFP versus wild-type root elongation zone and differentiation zone segments. C, Distribution of AtRH(-RHM) genes and AtRHM genes, based on relative transcript levels in the meristematic, elongation, and differentiation zones of wild-type roots (i.e. expression profiles). The nine expression profile types (defined by Huang and Schiefelbein [2015]) are indicated in the graphs at bottom (from left to right: meristematic, elongation, and differentiation zones). NE, No expression detected. Asterisks indicate profile types with significantly different proportions between the two groups (P < 0.01, χ2 test, Bonferroni corrected). D, Distribution of the number of gene families resulting from 1,000 random draws of 543 genes from the 12,449 total AtRH genes in the GreenPhyl family database. The observed numbers of gene families (397) that contain the 543 AtRHM genes are indicated.

