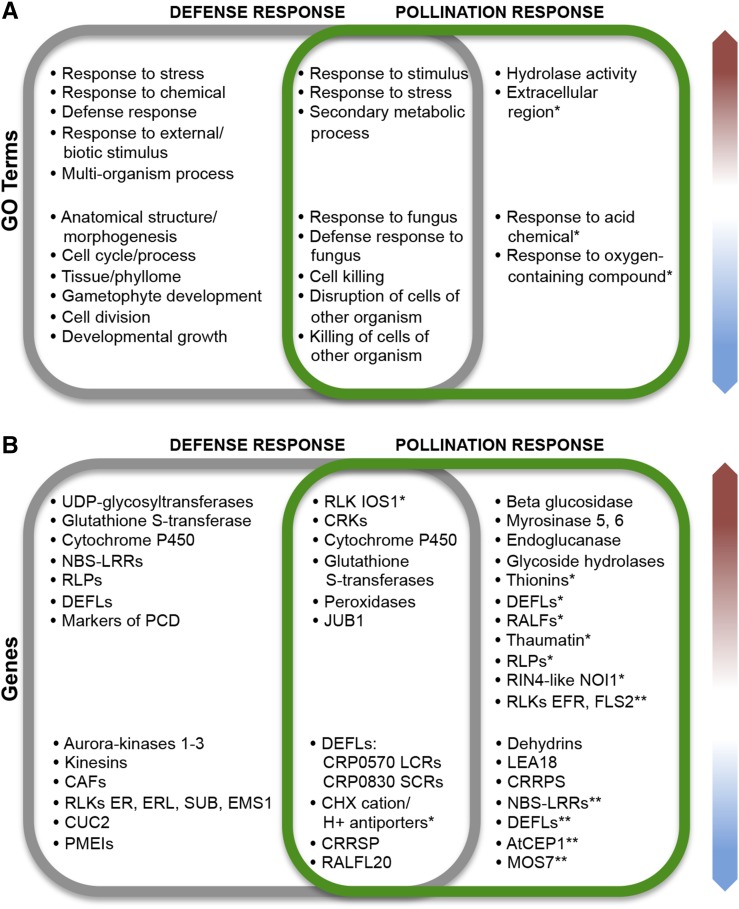
Figure 8.
Summary comparing the main aspects of pistil immune and pollination responses in A. thaliana and A. halleri. A, Top overrepresented GO terms shared by DEGs from both plant species (red arrow indicates up-regulated and blue arrow indicates down-regulated genes). B, Genes or gene families differentially expressed under the same conditions in A. thaliana and A. halleri pistils. Asterisks mark GO terms and genes differentially expressed only in A. thaliana (*) or only in A. halleri (**).

