Figure 1.
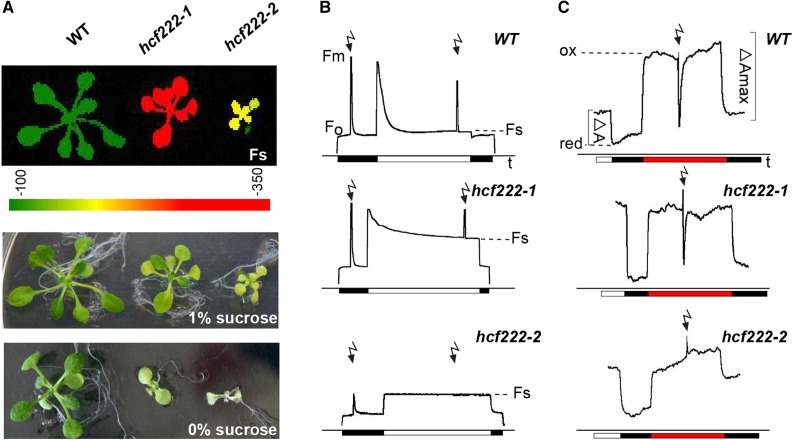
Phenotype and photosynthetic capacity of hcf222 mutants. A, In the top image, steady-state fluorescence (Fs) of mutants was visualized with an imaging fluorometer. The signal intensity of Fs is indicated by the color scale bar below the image. The other images show representative mutant plants grown under autotrophic or heterotrophic conditions. Seedlings were cultivated for 3 weeks on one-half-strength Murashige and Skoog medium, supplied with Suc as indicated. B, Chlorophyll fluorescence induction kinetics were recorded after dark adaption of seedlings for 5 min. Saturating white light pulses (flash symbols) of 5,000 μmol m−2 s−1 were applied to determine Fm and Fm′. Actinic light has an intensity of 120 μmol m−2 s−1. C, P700 absorbance kinetics were measured with a modified PAM fluorometer. After illumination of seedlings with actinic light for 5 min, light was switched off and P700 was oxidized by far-red light of 720 nm and 15 μmol m−2 s−1; saturating white light pulses were like those for chlorophyll fluorescence measurements. Black bar, actinic light off; white bar, actinic light on; red bar, far-red light on. Twenty- to 24-d-old intact seedlings were used for all measurements. One representative curve for at least five different measurements for each mutant is depicted. WT, Wild type.

