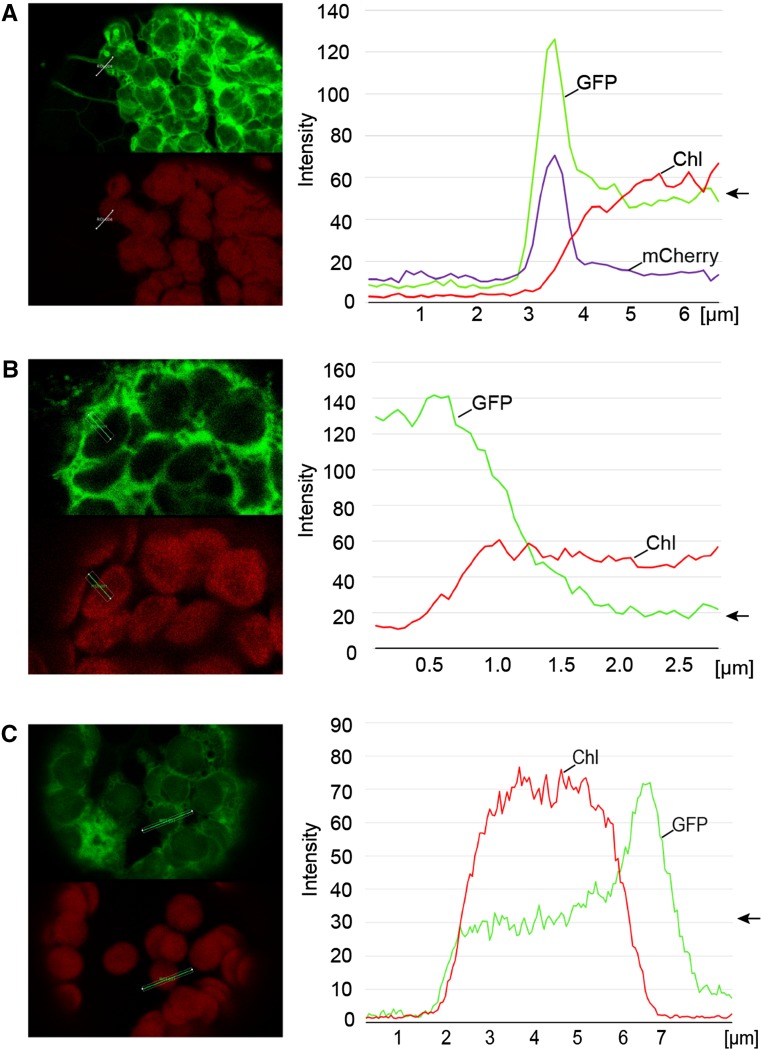
Figure 7.
Quantification of fluorescence emission in chloroplasts and ER. A, Analysis of N. benthamiana protoplasts transformed with HCF222-GFP and the corresponding fluorescence profile. B, Control with cytosolic GFP. C, Fluorescence profile of HCF222-GFP fluorescence in Arabidopsis protoplasts that stably expressed the fusion protein in the mutant background of hcf222-2. The arrows mark the levels of GFP fluorescence inside the chloroplasts. All profiles were directed from the cytosol/vacuole into the chloroplast. Fluorescence profiles were generated with the profile tool of the software package LAS X (Leica Microsystems). Chl, Chlorophyll autofluorescence.

