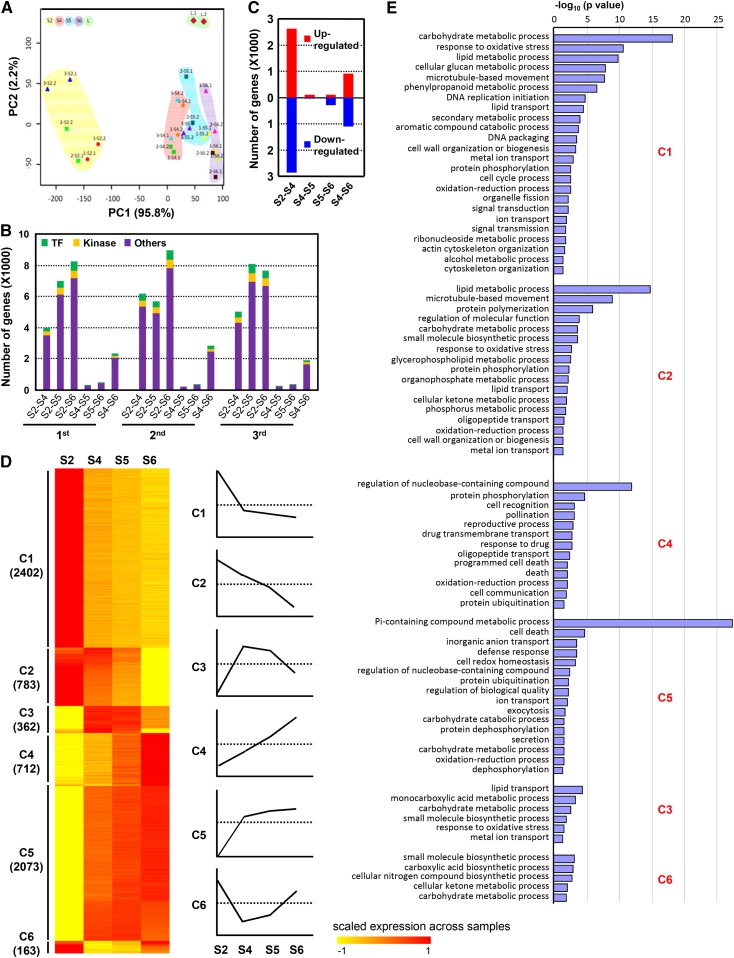
Figure 3.
Genome-wide gene expression profiles of the rice lamina joint. A, PCA reveals the spatial and temporal features of the examined samples (with repetition). Samples were named as follows: 1-S2.1, first repetition of the lamina joint of the first leaf at stage 2; 3-S4.2, second repetition of the lamina joint of the third leaf at stage 4; L, adjacent leaf parts. PC1 and PC2, Principal components 1 and 2. B, Number of genes showing differential expression between every two developmental stages (S2–S4, S2–S5, S2–S6, S4–S5, S5–S6, or S4–S6) of lamina joints from flag (first leaf), last second, and third leaves. Numbers of genes encoding TFs, kinases, or others are shown. C, Numbers of DEGs between two continuous stages of lamina joints of the last three leaves. D, Heat map of DEGs (identified in B), which can be classified into six distinct patterns (clusters 1–6) by the K-means clustering method. Expression values were scaled per gene across samples and are shown as the scaled expression. Diagrams of the expression patterns are shown (right), and gene numbers of each cluster are indicated. E, Enriched GO process terms for clusters 1 to 6 (from C), which were summarized using REVIGO. Column length indicates the overrepresentation significance of a group of GO terms.

