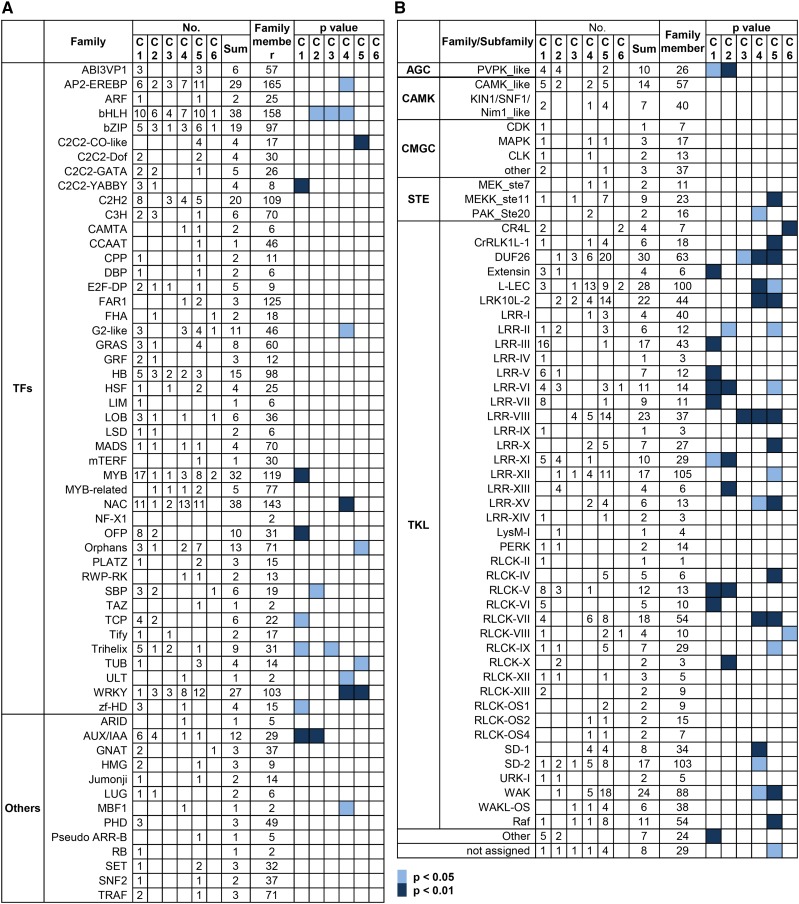
Figure 4.
Expression profiles of DEGs encoding TFs and kinases during lamina joint development. Numbers of DEGs and enrichment of a given gene family encoding TFs (A) or kinases (B) are shown. Gene members presenting expression patterns (C1–C6, as described in Fig. 3D) or members of a dedicated gene family are indicated. Enrichment of the gene family is indicated by calculating the P values by Fisher’s exact test.

