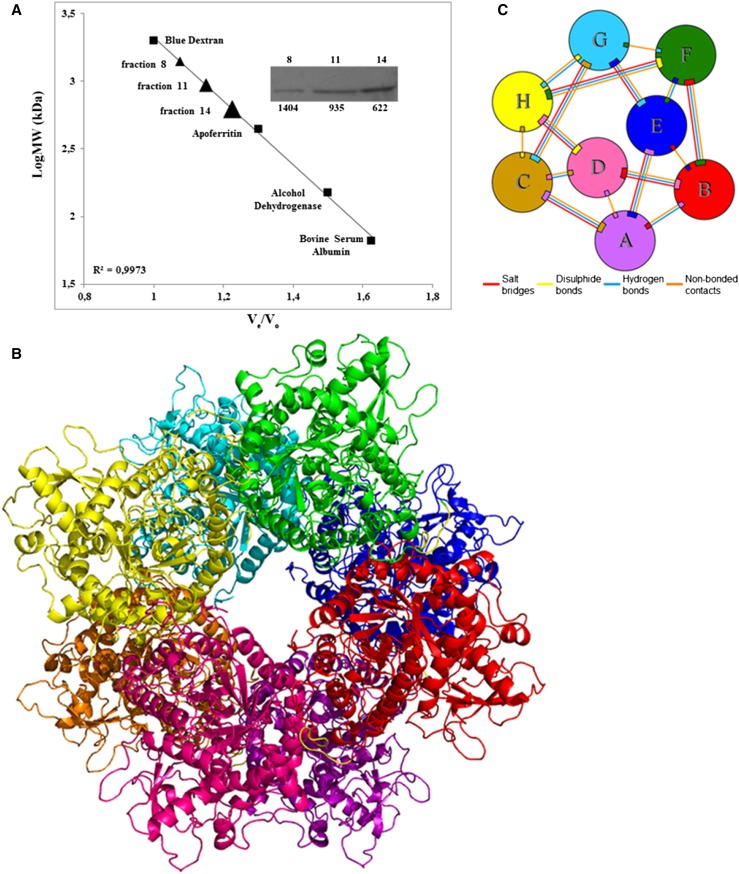
Figure 5.
OeGLU multimerizes. A, Calibration curve of the column used for gel filtration chromatography using the molecular weight marker proteins (squares). Protein extract from tobacco plants transiently expressing OeGLU, was applied to the column and the protein fractions obtained were immunodetected with anti-FLAG (Supplemental Fig. S4). OeGLU was mainly detected in the fractions indicated on the calibration curve (triangles). The numbers above the inset correspond to the protein fractions collected and the numbers below to the calculated molecular masses (measured in kD). B, Overall predicted quaternary structure of the octameric conformation of OeGLU based on in silico analysis. C, Schematic diagram of the interactions between eight monomers (A–H). Colored lines joining the polypeptide chain monomers represent a different type of interaction as indicated. Ve, elution volume; Vo, void volume; LogMW, log (molecular weights).

