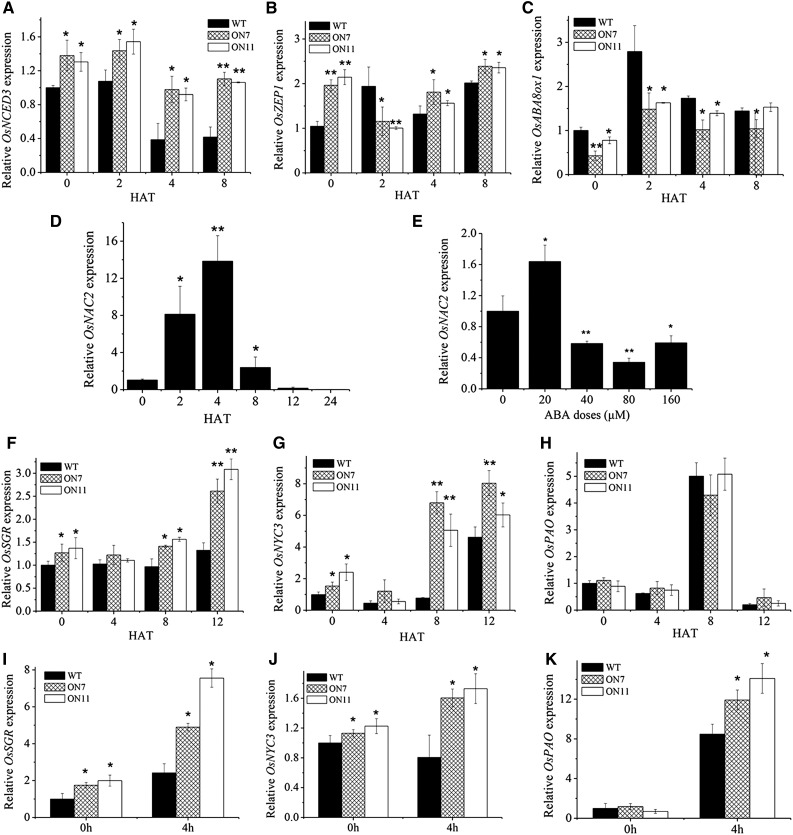
Figure 8.
Expression of ABA metabolism and senescence-related genes after different concentration of ABA treatments. A to D and F to H, Treatments with 20 µm ABA. I to K, Treatments with 80 µm ABA. Relative mRNA level was calculated using the ΔΔCT method from triplicate data. OsActin was used as an internal control to normalize the different samples with the same amount of plant RNA. Data are mean ± se with three replicates. Asterisks indicate a significant difference between wild-type and OsNAC2 transgenic lines by t test: *P < 0.05, **P < 0.01, and ***P < 0.001.

