Figure 4.
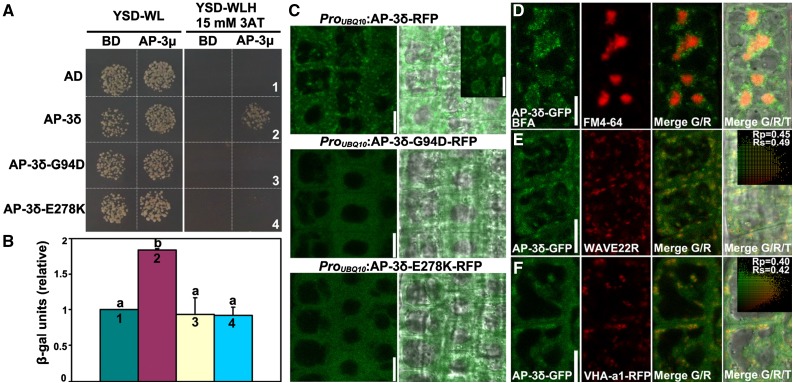
Gly-94 and Glu-278 of AP-3δ are key residues affecting AP-3 complex formation and subcellular targeting. A, Y2H assays between AP-3μ and AP-3δ or its mutants (G94D and E278K). Yeast strains cotransformed with Binding domain (BD)-AP-3μ and Activation domain (AD)-AP-3δ fusion constructs were growing on nonselective plates (-WL) or on selective plates (-WLH/15 mm 3AT). BD or AD alone was used as the control, respectively. 3AT, 3-Amino-1,2,4-triazole. Results shown are representative images from five independent experiments. B, Quantification of β-galactosidase activity from the Y2H assay as shown in A. Results shown are means ± se (n = 5). Each number (1–4) corresponds to the yeast strain labeled in A. Different letters indicate significantly different groups (one-way ANOVA, Tukey-Kramer test, P < 0.01). C, CLSM of root epidermal cells expressing RFP translational fusions of AP-3δ, AP-3δ-G94D, or AP-3δ-E278K. The inset shows CLSM of root epidermal cells expressing AP-3δ-RFP treated with BFA for 50 min. Merges of fluorescence and transmission images are shown at the side. D to F, CLSM of root epidermal cells expressing AP-3δ-GFP, colabeled with FM4-64, and treated with BFA (D) or coexpressed with the Golgi marker WAVE22R (E) or with the TGN/EE marker VHA-a1-RFP (F). Merges of the RFP/GFP channels (R/G) and merges of the RFP/GFP/transmission channels (R/G/T) are shown at the right. The Pearson correlation coefficient (Rp) and the Spearman correlation coefficient (Rs) are shown on the scatterplots at the right. Bars = 10 µm.

