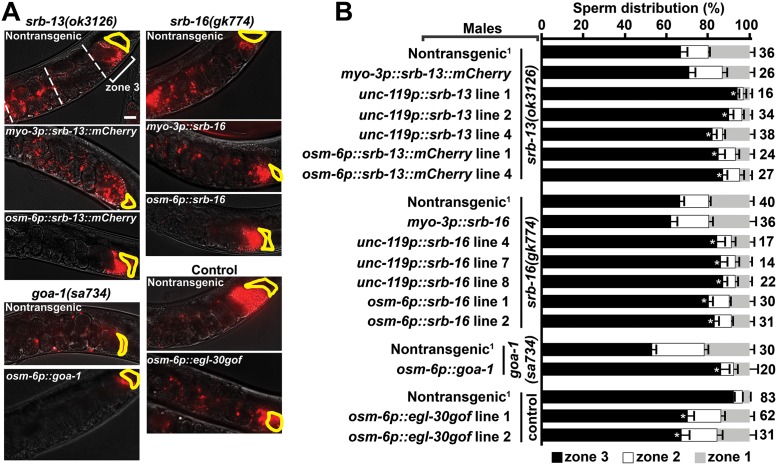
Fig 3. SRB pathways function in amphid sensory neurons.
(A) Wild-type hermaphrodite uteri images 1 hour after mating to mutant or control males expressing indicated transgenes. Fluorescent sperm are red due to MitoTracker labeling. Spermathecae are outlined in yellow. Bar, 20 μm. (B) Quantification of sperm distribution values (mean ± SEM). Number of scored uteri is on the right. *, p<0.001 compared to the nontransgenic control in each group. Multiple independent transgenic lines were scored. Additional underlying data can be found in S1 Data.

