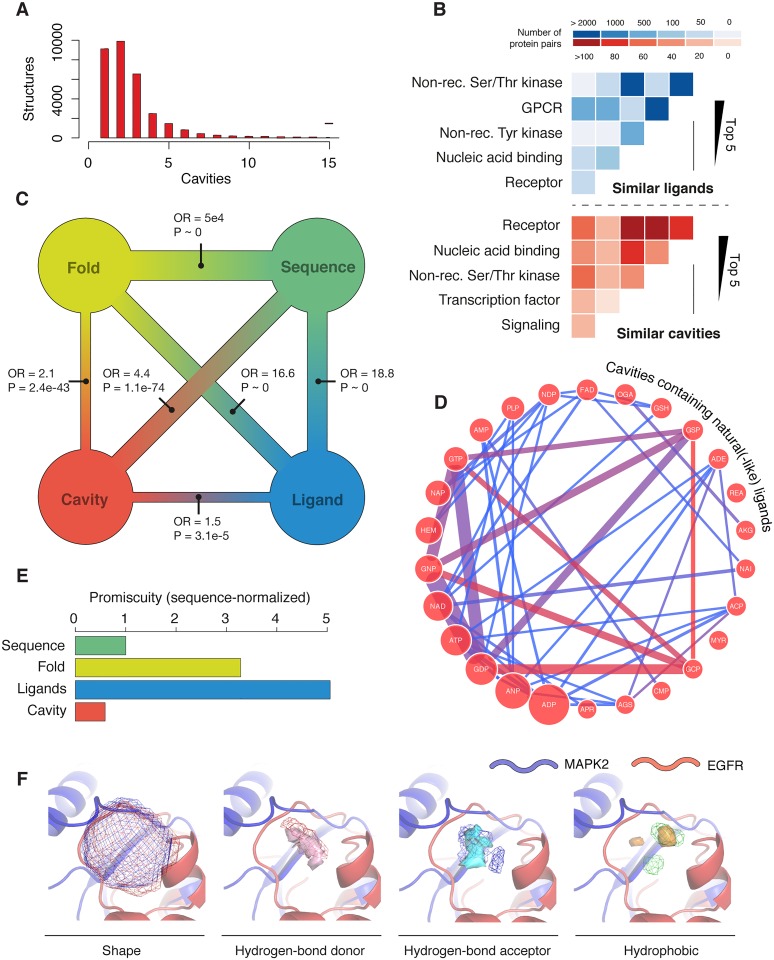
Fig 1. The space of cross-pharmacology.
(A) Number of cavities per structure (only structures with at least one cavity are included). (B) Top-5 families emerging from a ligand- (blue) and structure-centered (red) protein comparison. Darkness of the cells quantifies the number of protein pairs. (C) Protein-protein similarity based on cavities, fold, sequence and ligands. OR refers to the enrichment odds ratio of the comparison between two similarity spaces, accompanied with its P-value. Larger ORs correspond to more coincidence of pairs; for instance, as expected, most pairs that have a similar sequence also have a similar fold. (D) Cross-pharmacology of cavities containing ubiquitous natural(-like) ligands in the PDB. In the diagram, an edge is drawn between two ligands if a pair of similar cavities containing each of them is found, being the width of the edge proportional to the pairs of proteins where this happens. Notice, e.g., the cluster formed by GTP, GDP, GSP and GCP, or by ATP-like or NAD-like molecules. Size of the nodes is proportional to the number of unique structures where the ligand is bound in a cavity. Only ligands found in at least 5 proteins are shown. (E) Specificity of protein cross-pharmacology, relative to the promiscuity based on sequence similarity. Please note that these plots are sensitive to the choice of similarity cutoffs. Rather than represent optimality to capture polypharmacology, these cutoffs were chosen to exemplify commonly taken thresholds in the scientific literature. (F) Allosteric MAPK2 and EGFR cavities, superposed. Shape, hydrogen bond donor, acceptor and hydrophobic patterns are shown.

