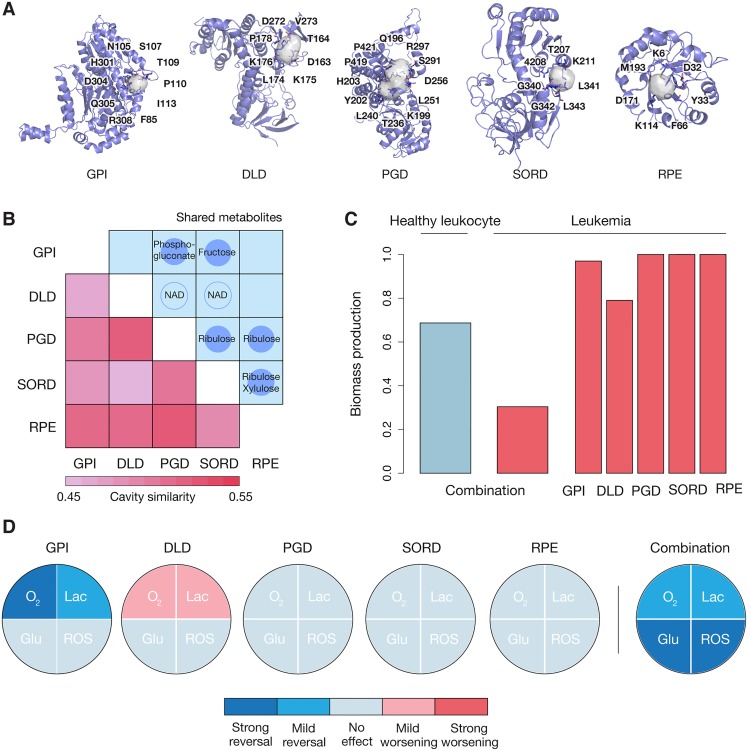
Fig 4. A selective target combination.
(A) Structures of GPI (PDB ID: 1iri, chain C), DLD (PDB ID: 1zmc, chain C), PGD (PDB ID: 2jkv, chain D), SORD (PDB ID: 1pl8, chain C) and RPE (PDB ID: 3ovp, chain C) are displayed, together with cavity residues. Please note that these cavities are representative, as several structures exist for each of the proteins. For a deeper exploration, please refer to Supporting S1 Data. (B) Best similarity between cavities in GPI, DLD, PGD, SORD and RPE. Highest similarities represent, in principle, easier cases of polypharmacology design. In the upper triangle, the main metabolic chemotypes related to the enzymes are also displayed. (C) Reduction of biomass production upon the simultaneous inhibition in cancer (red) and normal (blue) cell lines. The effect of individual inhibitions in also showed. (D) Influence of each inhibition on metabolic cancer hallmarks. O2 stands for oxygen consumption, Lac for lactate secretion, Glu for glucose uptake, and ROS for reactive oxygen species production. The assignment of ‘strong' and ‘mild’ reversals was based on visual inspection of the maximal flux of the corresponding reactions. When the maximal flux approached (>50% of the difference) the healthy cell line, it was classified as ‘strong reversal' ('strong worsening' if it otherwise diverged); `mild' effects were assigned to effects of less than 50%; ‘no effect' was assigned when one could observe essentially no change.

