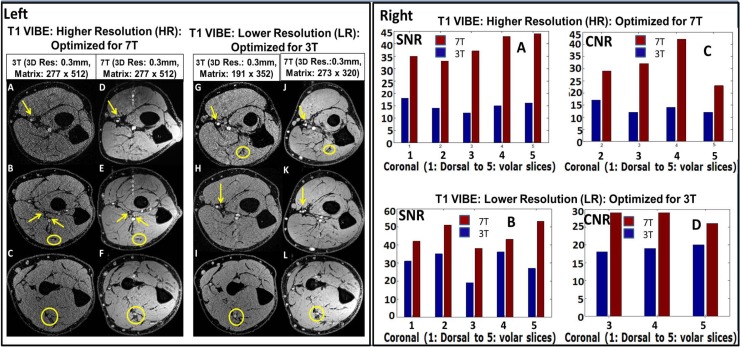
Fig 1.
Left: 3T vs. 7T T1 VIBE images on both higher [HR which is optimized for 7T] and lower [LR which is optimized for 3T] resolutions [as described Table 1]. In the 3T images [A, B, C, G, H and I], smaller order vessels as indicated by arrows are barely visible; while they are well detected on the 7T images [D, E, F, J, K and L]. Yellow arrows indicate micro-vessel branches and yellow ellipses delineate nerves from surrounding muscle plane. Note motion and pulsatile flow artifacts [band of bright points] originating from the median artery in the anterior to posterior phase encoding direction. Right: SNR and CNR charts for T1 VIBE images. [A and B] and [C and D] represent SNR and CNR; respectively. The 7T SNR and CNR were ~ 2/1.5 times that of 3T for the HR/LR scans, respectively. Out of all three volunteer, the above data is from single volunteer only.

