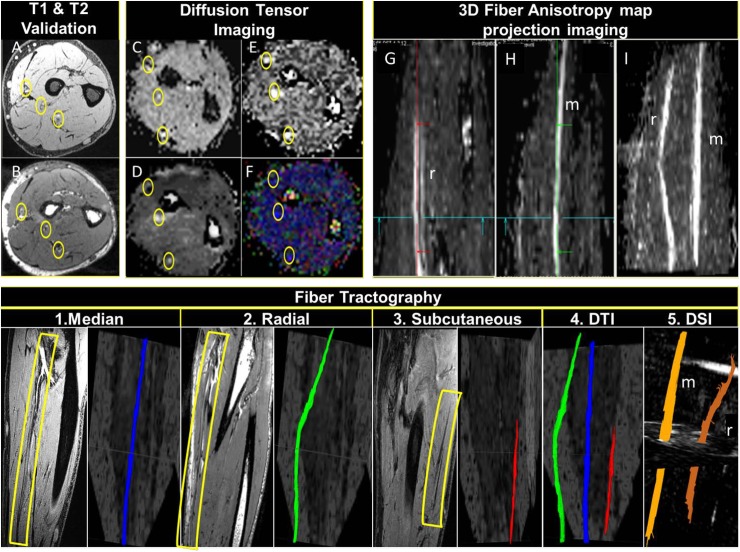
Fig 7.
Top row: 7T DTI with T1 VIBE and T2 DESS validation: A represents T1 VIBE image and B represents T2 DESS image for validation of the locations of the forearm nerves [yellow circles]. C, D, E and F represent ADC, FA, TRACEW, and color-coded DTI map identifying forearm nerves, respectively [note the rotation of the T1 VIBE and T2 DESS images to match the DTI ones.] G and H represent FA map in sagittal view showing median [m] and radial [r] nerves using multiple intensity projection [MIP]. I demonstrates multiple intensity projection [MIP] of combined m and r nerves. Bottom row: 7T fiber tractography: 1, 2 and 3 show DTI FA maps demonstrating separate forearm nerves with anatomical validation [yellow rectangles] side by side. 4 and 5 demonstrate 3D DTI and DSI rendering showing forearm nerves tractography, respectively.

