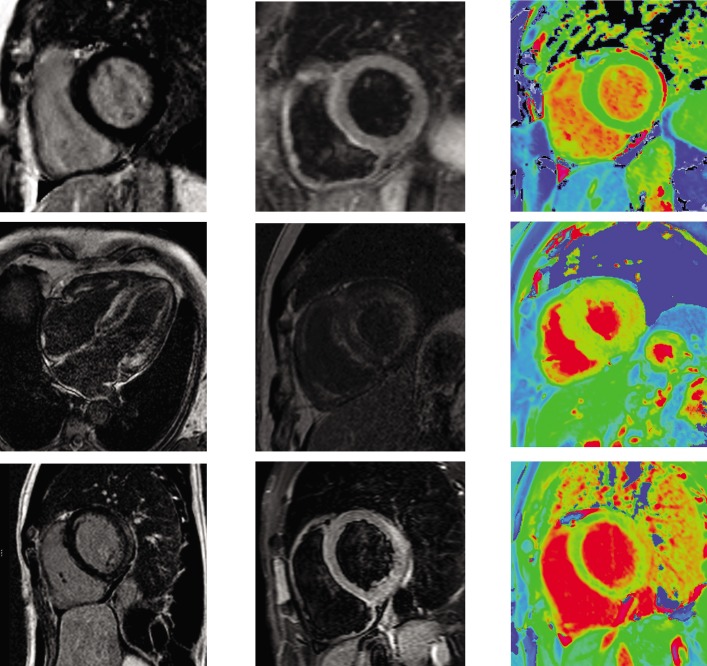
Figure 6: Multi-parametric Assessment of Normal Heart, Cardiac Amyloidosis and Acute Myocarditis.
Top row: normal appearances on LGE (left), T2 STIR imaging (middle), and native T1 mapping (right). Middle row: cardiac amyloidosis on LGE imaging (left, middle) demonstrates abnormal blood-pool appearance with ‘zebra-stripe’ enhancement of and difficulty nulling the myocardium; there is heterogeneous diffuse increase in myocardial T1 on native T1 mapping (right). Bottom row: acute myocarditis demonstrates subepicardial lateral-wall enhancement on LGE imaging (left), diffusely increased signal relative to skeletal muscle on T2 STIR imaging (middle), and increased lateral wall T1 on native T1 mapping (right). LGE = late gadolinium enhancement; STIR = short T1 inversion recovery.

