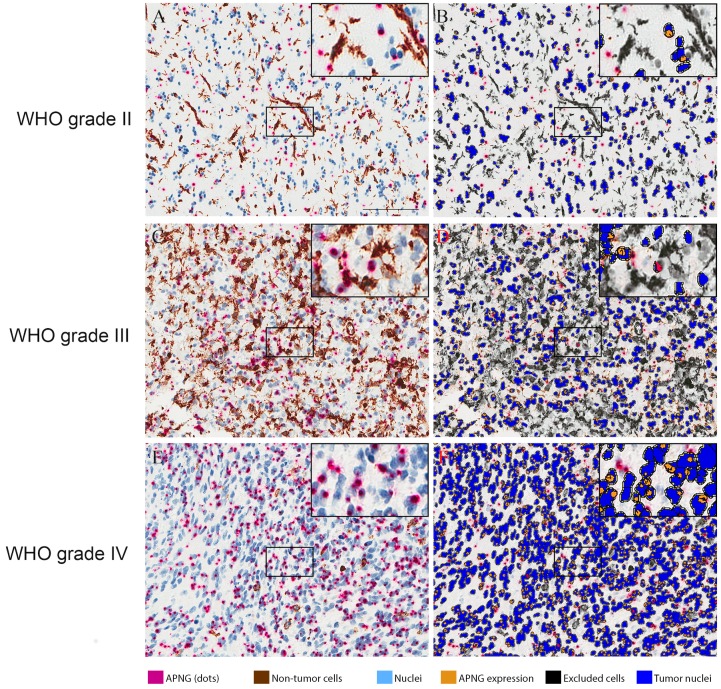
Fig 1. Images of APNG staining in different tumor subtypes.
APNG expression visualized using quantitative immunohistochemistry (qIHC). Endothelial cells, leukocytes and microglia/macrophages were excluded using co-stainings. A, C, E: APNG expression in the nuclei is visualized and quantified by the number of red dots. Non-tumor cells were stained with DAB. IHC stainings were evaluated by 1) exclusion of non-tumor cells (DAB) and 2) visualization of APNG expression (red dots) in the tumor cells. B, D, F: Non-tumor cells were automatically excluded and APNG analysis was applied on tumor cells; nuclei are blue and APNG expression visualized as qIHC dots are orange. Scalebar: 100 μm.

