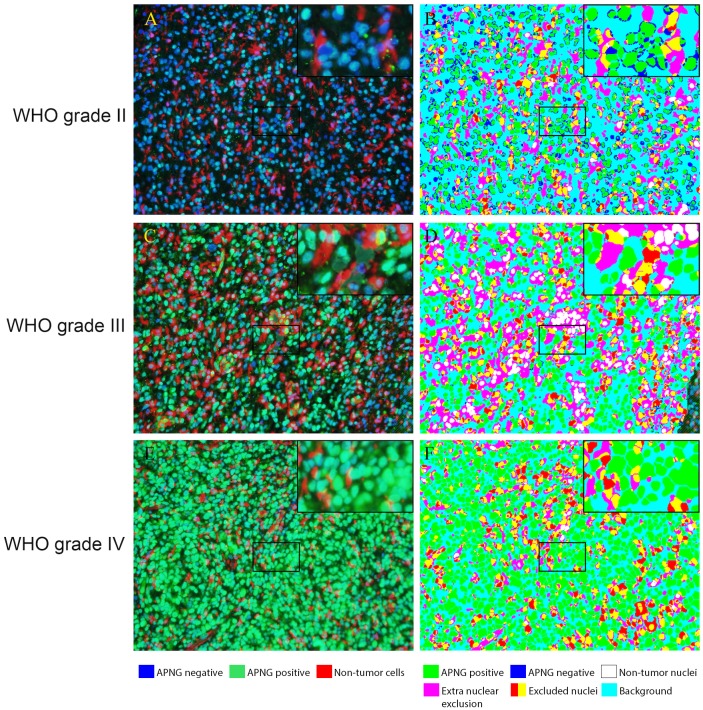
Fig 2. Staining of APNG and the corresponding processed images.
APNG expression visualized using quantitative immunofluorescence (IF). Endothelial cells, leukocytes and microglia/macrophages were excluded using co-stainings. APNG negative (blue) and positive (green) nuclei were identified. Non-tumor cells are red. In B, D and F the image analysis software identifies the cells as follows: APNG-positive tumor cell nuclei (green), APNG-negative tumor nuclei (blue), non-tumor cell nuclei (white), extra-nuclear exclusion cocktail staining (pink), excluded nuclei (red and yellow) and background (turquoise).

