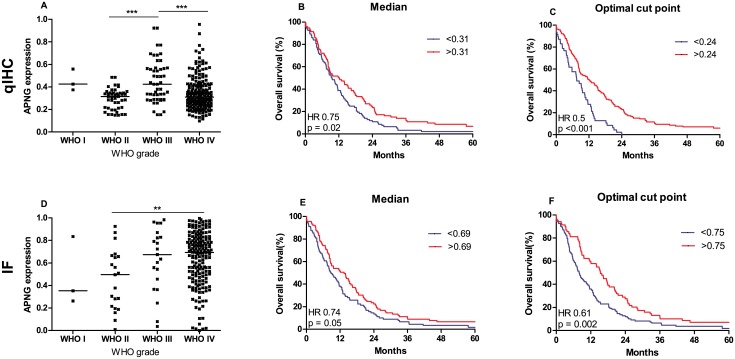
Fig 3. Box-plots and survival curves.
Box-plots showing the level of APNG and survival curves for APNG qIHC (A+C+E) and IF (B+D+E). qIHC: There is no difference between the expression in level in patients with WHO grade IV tumors and patients with WHO grade I, II, and III (A). Divided at median APNG was prognostic (P = 0.02) (C). At optimal APNG cut point (25% vs 75% of the patients), HR improved (P < 0.001) (E). IF: The expression in patients with WHO grade IV tumors was higher than the expression in patients with low-grade gliomas, but similar to the expression in patients with WHO grade III tumors (B). Divided at median there was a trend towards APNG being prognostic (P = 0.05) (D). At optimal APNG cut point (61% vs. 39% of the patients), APNG was a prognostic factor in univariate analysis (P = 0.002) (F).

