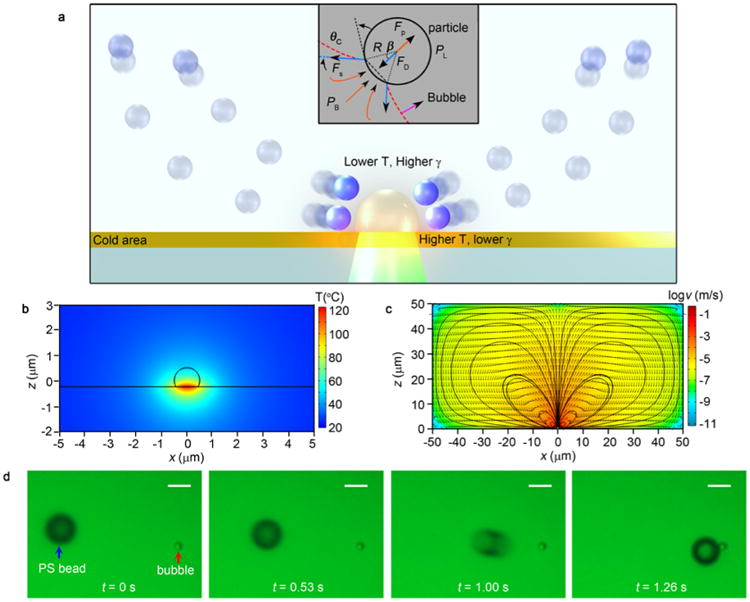
Figure 2.

Particle trapping at a microbubble that is generated through the plasmon-enhanced photothermal effects. (a) Schematic illustration (in a cross-sectional view) of the particle-trapping mechanism by a single microbubble. The blue spheres indicate the suspended particles in the DI water. The particles follow the convective flow due to the frictional force. The inset shows the force distribution when a particle is trapped by the microbubble (indicated as the red dash line). PB and PL indicate the pressure in the bubble and liquid, respectively, which introduce a net force of FP pushing the particle outward. The surface tension FS introduce a drag force FD. (b) Simulated temperature distribution around a 1 μm bubble in a cross-sectional view. (c) Simulated flow velocity distribution around a 1 μm bubble with logarithmic scale in a cross-sectional view. The black lines indicate streamlines of the convective flow. (d) Time-resolved trapping process of a single 5.31 μm PS bead by a 1 μm bubble. Scale bar: 5 μm.
