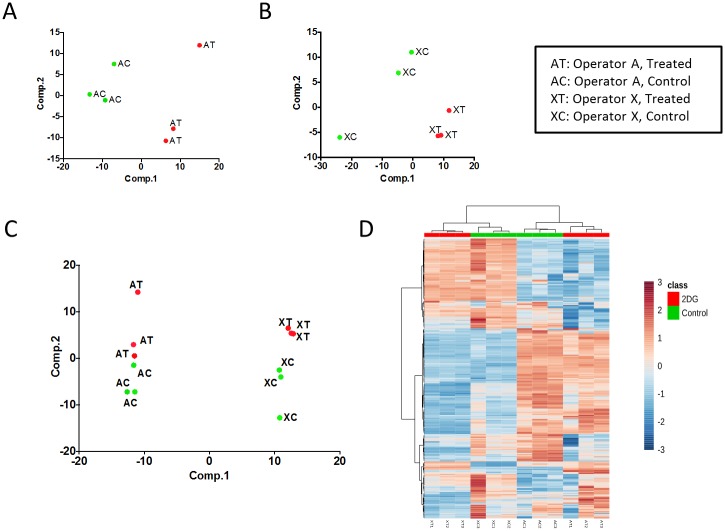
Fig 1. Description of the biological effects and batch effects in the metabolomics dataset used in this study.
- A) Results of principal components analysis (PCA) on data collected by operator A. Plots illustrate the first two PCs. Samples in green (AC) represent the three replicates from the control condition and samples in red (AT) show replicates from the drug treated condition (2DG = 2-deoxy glucose).
- B) PCA results as described in (A) using data collected by operator X.
- C) PCA results as described in (A) on the combined dataset containing samples from both operators A and X.
- D) Heatmap of metabolite abundances showing hierarchical clustering of the combined dataset. Columns represent samples and rows represent metabolites. Rows are scaled (mean centered and divided by standard deviation).

