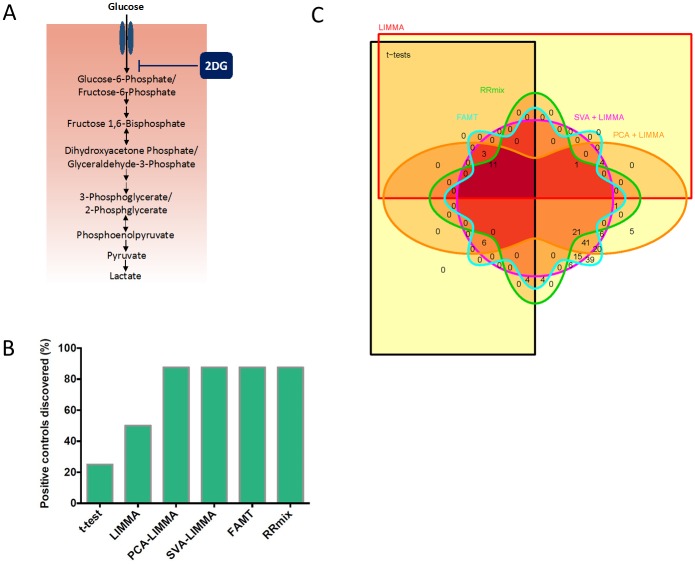
Fig 2. Comparison of performance of 6 methods in differential abundance analysis.
- A) Schematic depicting the enzymatic steps in glycolysis pathway and the step where 2DG inhibits upon treatment. The metabolites shown in the diagram were analyzed by LC-MS.
- B) Plot depicting the fraction of positive controls discovered by each method as significantly differentially abundant between the control and 2DG treated samples in the presence of batch effects.
- C) Venn diagram comparing total number of discoveries made by each of the methods in the combined dataset (at 0.9 posterior probability for RRmix and 10% FDR correction for other methods).

