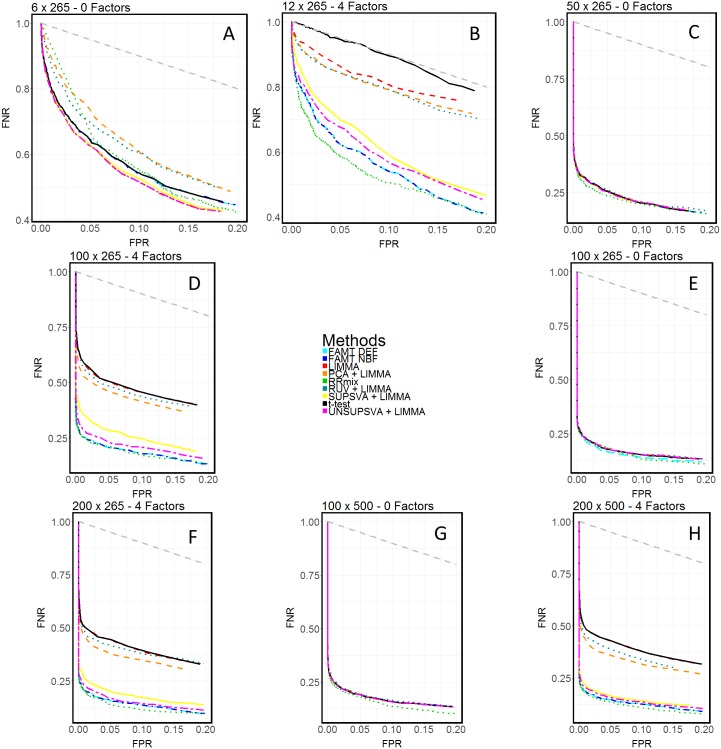
A) Detection-error tradeoff (DET) plots comparing the performance of the 9 methods in the absence of batch effects with 6 observations and 265 metabolites.
B) Detection-error tradeoff (DET) plots comparing the performance of the 9 methods in the presence of batch effects with 12 observations and 265 metabolites.
C) Detection-error tradeoff (DET) plots comparing the performance of the 9 methods in the absence of batch effects with 50 observations and 265 metabolites.
D) Detection-error tradeoff (DET) plots comparing the performance of the 9 methods in the presence of batch effects with 100 observations and 265 metabolites.
E) Detection-error tradeoff (DET) plots comparing the performance of the 9 methods in the absence of batch effects with 100 observations and 265 metabolites.
F) Detection-error tradeoff (DET) plots comparing the performance of the 9 methods in the presence of batch effects with 200 observations and 265 metabolites.
G) Detection-error tradeoff (DET) plots comparing the performance of the 9 methods in the absence of batch effects with 100 observations and 500 metabolites.
H) Detection-error tradeoff (DET) plots comparing the performance of the 9 methods in the presence of batch effects with 200 observations and 500 metabolites.

