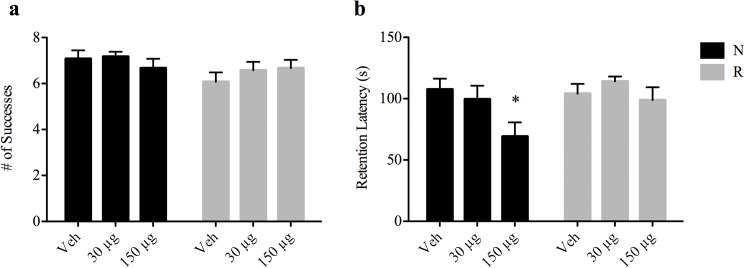
Fig 2. Effect of iron supplementation on cognitive development.
(a) T-maze test scores at PD35. Scores between N-veh and R-veh groups were not significantly different (7.08 ± 0.36 successes vs. 6.08 ± 0.40 successes, p = 0.08) and no differences were found in scores between treatment groups. (b) Passive avoidance test at PD40. Data is expressed as time (s) taken to enter the dark chamber on d2 of the test, designated as retention latency. Latency was significantly decreased in N-150 μg pups compared to the Veh controls (107.54 ± 8.73 s vs. 69.14 ± 11.55 s, * p < 0.05, one-way ANOVA). Data are presented as means ± SEM.

