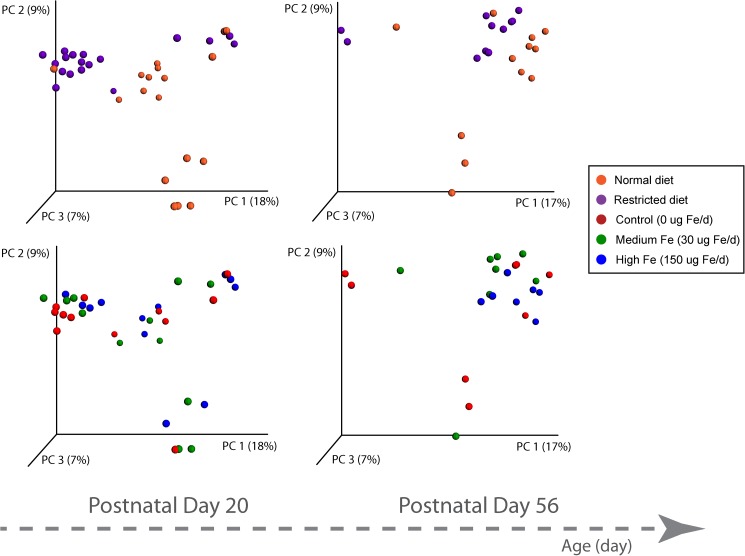
Fig 6. Principal coordinates analysis (PCoA) of 16s rRNA.
PCoA of unweighted Unifrac distances of 16S rRNA sequences demonstrates clustering along PC1 based on diet (upper half of the figure) (purple represents restricted and orange as normal) for day 20 and 56. Clustering based on iron supplement (lower half of the figure) (0 μg (Control), 30 μg (medium), or 150 μg (high)).

