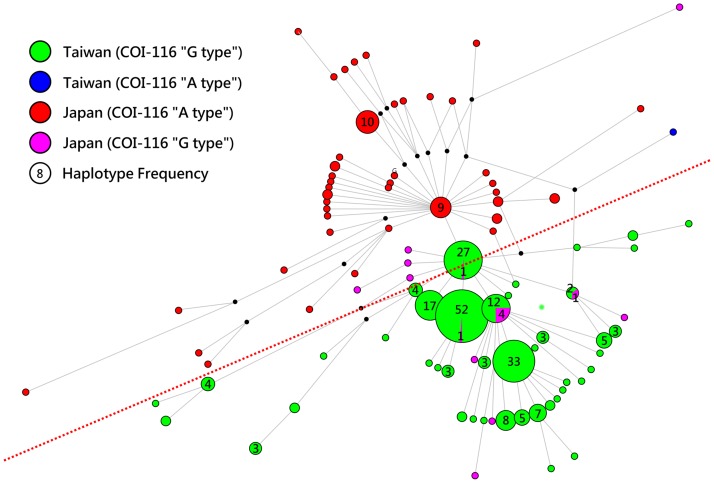
Fig 4. Haplotype network for 300 haplotypes of small abalone (Haliotis diversicolor).
Green, blue, red, and pink circles indicate haplotypes among sampling locations. The size of the circles is proportional to the haplotype frequencies. Lengths of the line are relative to the number of mutations among haplotypes. Haplotype networks represent the COI gene and states of the SNP site (COI-116) for each haplotype. Each circle corresponds to a distinct haplotype and lines connecting haplotypes to one mutational step. The numbers indicate additional haplotypes. Two subclades (Taiwan and Japan) are separated by a thin dashed line.

