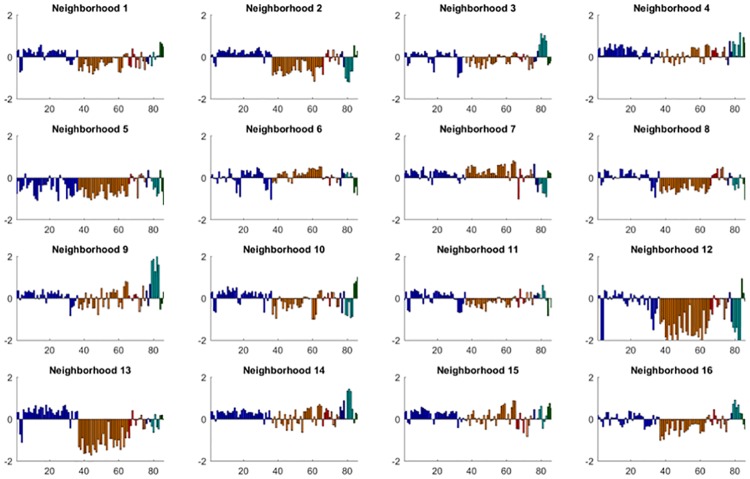
Fig 2. Performance profiles of the 16 hospital performance profiles.
The vertical bars represent the average normalized score for the central hospital in each neighborhood and its 10 nearest neighbors on the 84 quality measures. The vertical scale is standard deviations from the mean. The bars are grouped and shaded according to the domain of the quality measure (blue: process, orange: experience, red: value, purple: safety, navy: surgery, turquoise: readmission, green: mortality).

